Table of Contents
Report
Water Intelli-Buoy

Author(s):
- Sten Pajula
- Geert van Velthoven
- Charlotte Imenkamp
- Mireia Estruga Colen
- Hervé Houard
Acknowledgement
The team would like to start by showing gratitude to the persons without whom a project like this could never be implemented. First of all we want to thank to Instituto Superior do Porto (ISEP) in general for providing us with this opportunity. We are thankful to get constant encouragement, support and guidance from all supervisors which helped us in completing our project work. Also, we appreciate the constant support and lectures from our teachers.
Glossary
| Abbreviation | Description |
|---|---|
| DNS | Domain Name System |
| DO | Dissolved Oxigen |
| EPS | European Project Semester |
| GPRS | General Packet Radio Service |
| GPS | Global Positioning System |
| IP | Ingress Protection |
| ISEP | Instituto Superior de Engenharia do Porto |
| WBS | Work breakdown structure |
| MCU | Multipoint Control Unit |
| NIST | National Institute of Standards and Technology |
| NSPE | National Society of Professional Engineers |
| ORP | Oxidation-reduction potential |
| TSS | Total suspended solids |
| USB | Universal Serial Bus |
| WCDMA | Wideband Code Division Multiple Access |
- Introduction
- Presentation
The team takes part in the European Project Semester (EPS) at Instituto Superior de Engenharia do Porto (ISEP) in Spring 2018. It consists of five members from five different countries and five different scientific fields, which are pictured in figure tmm. Table tm describes every member from the left to the right in more detail.
<table tm> <caption>team members</caption>
| Name | Mireia Estruga Colen | Geert van Velthoven | Charlotte Imenkamp | Hervé Houard | Sten Pajula |
|---|---|---|---|---|---|
| Picture | left | central left | center | central right | right |
| Country | Spain | Netherlands | Germany | Belgium | Estonia |
| Course of study | Mechanical Engineering | Industrial Engineering and Management | Biomedical Engineering | Product Development | Electrical Engineering |
</table>
<figure tmm>
 <caption>Team members </caption>
</figure>
<caption>Team members </caption>
</figure>
One could see this diversity as a difficulty, but the team takes it as a great challenge. We are united by our motivation of getting to know different cultures, exploring the work with an international group for the first time and in the end completing the project successfully.
- Motivation
The team´s main concern for the next half year will be developing a water Intelli-Buoy. The choice of this topic was very easy, because everyone could see himself developing a project like this from the first time. And everyone could see himself contributing his skills into this project. The expectations overlapped in many areas and the team just had to find those areas and combine the others into a common picture. These personal interests were grounded on different backgrounds and scientific knowledge.
- Problem
Water is one of the most important resources on earth. When humans come in contact with water in pools or urban lakes, it is urgent to maintain the water quality on a regular basis. The World Health Organisation [1] states: “Parameter of immediate operational health relevance (…) should be monitored most frequently in all pool types” [2]. Monitoring the water quality is important to keep your pool or urban lake safe. An unmaintained pool can lead to a growth of microorganisms and bacteria which can kill the plants and infect humans with diseases. To maintain the pool in the most efficient way, we must address these issues by monitoring the condition of the water [3].
Measuring the water quality in swimming pools proves to be a time consuming activity [4]. With the water Intelli-buoy this task will be made easier. The water Intelli-buoy will help the customer to maintain his pool on his own without having any doubts about the quality and the risks which could be included. The state of the art addresses the question, on which market is already a solution for the problem and where can the team contribute to solve the problem.
- Objectives
The teams vision is to design, build and test a buoy equipped with sensors to collect data on the quality of the water of ponds or pools. The buoy should drift on the water, collect data and convert them into tips or warnings for the customer. Some possibilities would be measuring the turbidity level, which provides information about the condition of the filtration system [5] and temperature, which is directly connected to the oxygen saturation. This is important, if the pond/pool is inhabited by fishes or plants. [6] Furthermore our product will offer comfort to the customer. An app will make it easy to maintain the pool, provides suggestions for the best plants and fishes to use or can help in everyday problems like defining the best time to take a swim.
- Requirements
In order to ensure the personal and the compulsory goals of the project, the team has to follow functional, usability, technical and environmental requirements.
Functional requirements: The buoy must be a self sufficient prototype, which floats on the surface and collects data.
Usability requirements: The data must be read and presented user friendly way (mobile application / browser).
Technical requirements: Comply with the following EU Directives:
- Machine Directive (2006/42/CE 2006-05-17) [7];
- Low Voltage Directive (2014/35/EU 2016-04-20) [8];
- Radio Equipment Directive (2014/53/EU 2014-04-16) [9];
- Restriction of Hazardous Substances (ROHS) in Electrical and Electronic Equipment Directive (2002/95/EC 2003-01-27) [10];
- Electromagnetic Compatibility Directive (2004/108/EC 2004 12 15)[11];
Additionally the prototype protection class IP67 (Protection against liquids) and the adoption of the International System of Units (NIST) [12] is mandatory.
Environmental requirements: The materials and manufacturing must follow particular environmental requirements, which are addressed in the environmental ethics and sustainability accordingly.
Limitations: Use a maximum budget of 100 €, low cost hardware solutions and open source software.
- Functional Tests
In order to examine the function of the final application the following software and hardware tests are inherent.
Software:
- Testing the sensor related software
- Testing the application software
Hardware:
- Watertightness
- Floatability
- Sensors (turbidity and temperature)
- Electrical functions (WiFi-module, battery, cables)
- Project Planning
As one of the most fundamental parts of the project the planning must not be underestimated. It serves as a “roadmap” and guides the way to the completion of the project. For this purpose the project plan in Table pp is divided into deliverables (blue background) and their tasks. They are specified by a short description and a responsible person. Defining a responsible person is highly important to ensure the correct completion on time.
<table pp> <caption>Planning table</caption>
| Task | Responsible |
|---|---|
| Project Proposal | |
| Task Identification and allocation | The team |
| Gantt chart | Sten |
| Technical research | Charlotte |
| Market research, existing products | Geert |
| Initial budget planning | Mireia |
| System Design | |
| Specific plan | Sten and Hervé |
| Business plan | Hervé and Geert |
| Final schemes and diagrams | Sten |
| Interim | |
| Presentation | Charlotte |
| Report | Mireia |
| Detailed Design | |
| Construction hardware | Mireia |
| Construction software | Sten |
| Assembly | Geert |
| Testing | |
| Functional tests | The team |
| Final | |
| Report | Geert |
| Video | Charlotte |
| Poster | Hervé |
| Manual | Mireia |
</table>
- Report Structure
The report is structured into eight chapters, which are described in Table RS.
<table RS> <caption>Report structure</caption>
| Chapter | Title | Description |
|---|---|---|
| 1 | Introduction | It introduces the team and the project with its objectives and requirements. |
| 2 | State of the art | The existing technologies and different fields are analyzed. This leads to the final scope of the product. |
| 3 | Project management | Documentation of the progress including all the tasks and time allocations. |
| 4 | Marketing plan | This deals with the marketing strategy, target and advertising. |
| 5 | Eco-efficiency measures for sustainability | Analysis of the necessary steps to make the project sustainable. |
| 6 | Ethical and deontological concerns | Analysis of the ethical challenges and their solutions. |
| 7 | Project development | The whole progress of the work including architecture, functionalities and tests. |
| 8 | Conclusions | The final conclusion of the project followed by possible future developments |
</table>
- State of the Art
- Introduction
A buoy is a distinctively shaped float that can have many purposes and for this reason there are different types of buoys: sea mark, lifebuoy, submarine communication buoys, weather buoys and many more [13]. They can be anchored or allowed to drift with ocean currents.
Traditional buoys have short lifecyles and they need a lot of maintenance, for this reason we will provide the maintenance of the buoy. Our project is based on a water Intelli-buoy, therefore we want to focus on equipping the buoy with sensors to collect data on the quality of the water.
This chapter describes two existing products related to scientific buoys and four consumer products for pools to finally make a comparison and find a niche in this sector. We also are going to talk about natural swimming pools, the product-service system and the sensors.
- Existing products
- Industrial products
The first big field of buoys is the market of industrial/ scientific buoys. The purpose of scientific buoys is monitoring the water quality in a high level. This data is particularily used for weather forecasts and environmental researches. Scientists and oceanographers commonly use them to study current behavior in the oceans. In order to get an overview of the existing industrial technology we selected different products (YSI EMM2.0 Coastal Buoy and Startup project). These are described in the sections that follow.
- YSI EMM2.0 Coastal Buoy
YSI offers several buoys for exact and ongoing monitoring of the water quality. We picked the EMM2.0 Coastal Buoy (see Figure cb) as an example. Its focus is on indestructibility and the variety of functionalities, tailored to fit the customer needs. This indestructibility is reflected by the deck structure built of galvanized steel and the aluminium components. The body is made of foam and isolation bushings are used between dissimilar metals. The variety of functionalities is for instance reflected by a wide range of sensors like metal analyzers, water quality monitors, GPS, atmospheric sensors and wave sensors [14].
<figure cb>
 <caption>YSI Coastal Buoy [15]</caption>
</figure>
<caption>YSI Coastal Buoy [15]</caption>
</figure>
- Startup project
The “Diy buoy” project, shown in Figure db, is not on the market yet, but nevertheless it is a promising project, which is worth discussing. The purpose of the buoy is drifting through the ocean and collecting data for weather forecast.
<figure db>
 <caption>Diy buoy [16]</caption>
</figure>
<caption>Diy buoy [16]</caption>
</figure>
One big advantage here is that the majority of the components (like the block diagram in Figure bd) and some parts of the work process are freely available. The main component of the buoy is an Arduino Trinket Pro 5 V from Adafruit. A solar panel charges a small Lithium Polymer battery to provide power even when the solar panel is not working. The buoy collects data from the onboard GPS and several temperature sensors. It sends informations about latitude and longitude, speed, instantaneous direction, water and internal board temperature, tilt angle and days the program has been running. This data is transmitted via satellite communication at a prescribed time each day. The system allows two-way communication and tracking of the buoy. The exact position can be seen on a website [17].
<figure bd>
 <caption>Block diagram [18]</caption>
</figure>
<caption>Block diagram [18]</caption>
</figure>
- Comparision
The most serious issue of developing a scientific buoy is finding a niche to prevail over the competitors. The available products (compared in Table ci) are developed with high knowledge and budget.
<table ci> <caption>Comparision of industrial products</caption>
| Product | Advantage | Disadvantage | Price (€) |
|---|---|---|---|
| YSI EMM2.0 Coastal Buoy | A big variety of sensors | Many competitors and too expensive. | On request |
| Startup-Project | It runs on solar power and the tracking option is a niche in this field | A time intensive project like this goes beyond the scope | ~ 100 |
</table>
Due to our limited capacity in time (5 month) and the budged of 100 € (see chapter “Requirements”) building a buoy like those is not possible for us. Nevertheless, the materials of the coastal buoy and the sensors used in the Startup project could be helpful.
The team decides to continue the research with consumer products, which will be discussed in the following.
- Consumer products
The second big field for buoys is the market of consumer products. The purpose of a consumer buoy is monitoring the quality of the water in pools or ponds. With these buoys it is possible to monitor the temperature and some other parameters to get an overview of the quality of the water. This information helps pools or ponds owners to keep the quality of the water on a high level. In order to get an overview of the existing technology we discussed the following products.
- Bluetooth Pool Thermometer
The wireless pool thermometer (Figure bpt) shows the current temperature in the application, but you can also check the high and low temperatures for the past 24 hours, as well as to the highest and lowest temperatures ever reached. It also sends a notification when the water reaches a certain temperature and the application shows whether you are out of the range of the thermometer, and if the thermometer needs new batteries [19].
<figure bpt>
 <caption>Bluetooth pool thermometer [20]</caption>
</figure>
<caption>Bluetooth pool thermometer [20]</caption>
</figure>
- Pool Thermometer
The wireless pool thermometer (Figure pt) shows the current water temperature, inside temperature, outside temperature, humidity, temperature development and time on a display. The pool thermometer has also an alarm for the set minimal and maximal temperatures [21].
<figure pt>
 <caption>Pool thermometer [22]</caption>
</figure>
<caption>Pool thermometer [22]</caption>
</figure>
- Seneye Pond
The Senaye Pond (Figure sp) measures the water temperature, Ammonia (NH3), pH, total light and water level. The sensor is connected via Wi-Fi or USB. When the results are uploaded to the Internet you get some advice for your pond [23].
<figure sp>
 <caption>Seneye pond [24]</caption>
</figure>
<caption>Seneye pond [24]</caption>
</figure>
- Libelium World real time monitoring system
The real time monitoring systems like the Liebelium World real time monitoring system (see Figure lb) are used in industries, where mobility and reaction time is the key. It is commonly used in measurement of ions concentration for drinking water quality control, agriculture water monitoring, swimming pools or waste water treatment. In order to have a better overview we discussed the following product. Equipped with multiple sensors that measure a dozen of the most relevant water quality parameters, Waspmote Smart Water is the first water quality-sensing platform to feature autonomous nodes that connect to the Cloud for real-time water control [25].
<figure lb>
 <caption>Libelium [26]</caption>
</figure>
<caption>Libelium [26]</caption>
</figure>
Waspmote Smart Water is suitable for portable water monitoring, chemical leakage detection in rivers, remote measurement of swimming pools and spas, and levels of seawater pollution. Sensor probes measure more than 12 chemical and physical water quality parameters such as pH, dissolved oxygen (DO), conductivity (salinity), oxidation-reduction potential (ORP), turbidity, temperature, etc. The product is made out of polycarbon.
- Comparison
As the comparision in Table cp shows, a buoy as a consumer product for pools could be an affordable and feasible project for the team. One problem the table shows is the amount of existing products.
The following part introduces the natural pool as a possible niche for the product.
<table cp> <caption>Comparision consumer products </caption>
| Product | Advantage | Disadvantage | Price (€) |
|---|---|---|---|
| Bluetooth Pool Thermometer | Connection via Bluetooth and the Pool Thermometer gives notifications in the application. | Does not measures the quality of the water, only the temperature. | 33.65 |
| Pool Thermometer | Multipurpose meter for inside and outside with a lot of parameters. Has also an alarm for set temperatures. | Has a reach of 30 meters and does not measures the quality of the water, only the temperature. | 49.95 |
| pHin | Measures multiple parameters and gives advice in the application about adding chemicals pods. Those chemicals pods are also delivered by pHin. | High price. | 250.00 |
| Seneye Pond | Measures a lot of important parameters and gives advice about your pond. It is also easy to use and you can connect the Seneye Pond via USB of Wi-Fi. | Does not measures O2 or bacteria/algae. | 149.99 |
| Libelium World real time monitoring system | Connection via 3G, GPRS,WCDMA and ZigBee. Autonomy via solar panel. Usable for scientific research. Mobile, easy to install. | Expensive | On request |
</table>
- Natural Swimming Pool
Since 2015 natural swimming pools (see Figure np) are increasing in popularity. This is because natural pools require much less maintenance than a conventional pool, and their year-to-year costs are lower after construction is finished. They don’t require chlorine, chemical filtration or any of the other side costs and numerous daily and weekly chores that go with keeping a normal pool clean. They should still be kept well-skimmed and free from debris, but that’s really the extent of the maintenance you’ll need to do with your pool.
Organic water can take on a brownish tint depending on the presence of algae, and it’s impossible to completely remove sediment and some life from the pool. A high turbidity can also be caused by a dysfunctional filter. In order for plants to thrive, pH levels should be maintained between 5.5 and 7 [27]. If the pool is well-designed and located, it should require less maintenance than a conventional pool.
Another advantage is that there are not much exciting products in this niche that focuses on natural swimming pools to measure the quality of the water. There are only companies who build these natural pools and also provide maintenance, but not every customer wants this service. With our buoy the customer can do the maintenance of the swimming pool themselves and is there the possibility to get some advice about the plants that will be used for the filtration system [28].
<figure np>
 <caption>Natural pool [29]</caption>
</figure>
<caption>Natural pool [29]</caption>
</figure>
- Product-service system
pHin (see Figure ph) is reinventing pool and hot tub care with a Wi-Fi-enabled smart monitor and a mobile phone app to take away the guesswork. The pHin Smart Monitor continuously monitors your pool or hot tub water chemistry and temperature, and notifies your phone when you need to balance the water quality. All you need to do is add pHin’s pre-measured, single-dose, color-coded pods or get dosing instructions to use it with your own chemicals [30].
<figure ph>
 <caption>pHin [31]</caption>
</figure>
<caption>pHin [31]</caption>
</figure>
The pHin is sold as a product service, which means that the customer has to pay a monthly fee. The service of pHin depends on the service you want. There is a service with delivery of chemicals or a service without the delivery of chemicals (see Figure phin).
<figure phin>
 <caption>pHin Service [32]</caption>
</figure>
<caption>pHin Service [32]</caption>
</figure>
- Sensors
To be able to have a good view on the available sensors, a research on the existing technologies was made. This gave us an insight on what would be feasible within this project. Our main restriction for selecting the sensors is the budget, since we only have 100 € we should choose the sensors accordingly. The comparison (see Table sc) has shown us that pH-, turbidity- and temperature sensors could be within our reach, considering our small budget. We couldn’t find any affordable oxygen sensor, as the average prices go up to 160 €, we won’t be able to integrate such a sensor in our product. We also won't use a camera. Even though it is affordable it requires a high effort in software and hardware without offering significant benefits for the product.
<table sc> <caption>Comparison of sensors</caption>
| Sensors | Price (€) | Voltage (V) | Range | Accuracy | Size (mm) |
|---|---|---|---|---|---|
| pH | |||||
| Analog pH Meter Kit [33] | 30.98 | 5 | 0…14 pH | ±0.1 pH | 43×32 |
| Liquid PH 0-14 Value Detection [34] | 11.50 | 5 | 0…14 pH | / | 42x32x20 |
| Liquid PH Value Detection detect Sensor [35] | 11.00 | 5 | 0…14 pH | / | 42x32x20 |
| Turbidity | |||||
| DFROBOT SEN0189 [36] | 11.15 | 5 | / | / | / |
| Analog Turbidity Sensor For Arduino [37] | 8.00 | 5 | 5°C…90°C | / | 38x28x10 |
| Temperature | |||||
| Ds18b20 Thermometer [38] | 5.55 | 3.3…5.0 | -50°C…125°C | / | / |
| Dht11 Temperature and rel. humidity [39] | 0.87 | 5 | 0…60°C | ±2°C | 28x12x8 |
| 10k 1 NTC 1meter Thermistor [40] | 1.10 | / | -40…120°C | / | 4×25 |
| Oxygen | |||||
| Analog Dissolved Oxygen Sensor [41] | 136.00 | 3.3…5 | 0…20 mg/L | / | 42×32 |
| Dissolves oxygen kit [42] | 229.00 | 3.3…5 | 0.01…100mg/L | ±0.05 mg/L | 14×20 |
| Motion | |||||
| Arducam MT9D111 [43] | 8.12 | 1.7…3.6 | 10 bit | 2 MP | 4.5×3.4 |
| Atomic Market OV7670 [44] | 10.99 | 2.5…3.0 | 8 bit | 300 kP | - |
</table>
- Conclusion
The first step was to determine which water quality parameters would be monitored for safe recreational water environments, to accurately determine whether the water quality is within the specified regulations of the World Health Organization (WHO). It was determined from [45] that water parameters such as nitrate levels, free chlorine concentration and dissolved oxygen are too expensive to monitor and/or require frequent maintenance and calibration to sustain accurate readings over long periods of time. This would not be feasible for a long-term, real-time water quality monitoring.
Based on this study of the state of the art, the team decided to adopt the following. The developed product should be a buoy to facilitate the maintenance of a natural pool. It should measure turbidity and temperature, which is related to the oxigen saturation. This is the perfect niche in the field, because even though natural pools are a rising buissness, there are nearly no existing products on the market. For better customer service we want to offer the buoy included in a product service system. This means that the customer pays a monthly fee and the company repairs or upgrades the buoy frequently.
- Project Management
- Introduction
Project Management is the managing of a project. It is the way projects are organized, prepared, planned, executed and completed. In this chapter the following subject will be discussed:
- Scope
- Time
- Cost
- Quality
- People
- Communications
- Risk
- Procurement
- Stakeholders management
- Scope
To prevent that the main goal of the project is not realised a scope will be defined. A scope shows what subjects are part of the project and what parts are not. These subjects are shown in the Work Breakdown Structure (WBS) in Figure wbs. This WBS will help to develop the Gantt chart.
<figure wbs>
 <caption>WBS</caption>
</figure>
<caption>WBS</caption>
</figure>
- Time
- Gantt chart
To manage our time a Gantt chart was made. In this Gantt chart (Figure Ganttchart) the project is divided in six phases: Project proposal, System design, Interim, Detailed design, Testing and Final report. Every phase shows which deliverables and the deadlines of these deliverables. To complete these deliverables task are made and allocated to the team members.

 <figure Ganttchart>
 <caption>Gantt chart</caption>
</figure>
<caption>Gantt chart</caption>
</figure>
- Deliverables & Deadlines
In Table D&D the deliverables from the Gantt chart with the deadlines are summarized.
<table D&D> <caption>Deliverables & Deadlines</caption>
| Deliverables | Deadlines |
|---|---|
| Gantt chart and Task allocation | 2018-03-05 |
| Blackbox (System Diagrams & Structural Drawings and Cardboard Model | 2018-03-12 |
| Detailed Schematics, Structural Drawings and Cardboard Model | 2018-03-23 |
| List of Materials (what & quantity) | 2018-04-04 |
| Upload Interim Report and Presentation | 2018-04-14 |
| Interim presentation | 2018-04-19 |
| Selection of Local Providers & Final List of Materials & Components | 2018-04-23 |
| Upload refined Interim Report | 2018-05-02 |
| Upload results of the Functional Test | 2018-06-04 |
| Upload the Final Report | 2018-06-15 |
| Upload the Presentation, Video, Paper, Poster and Manual | 2018-06-18 |
| Final Presentation, Individual Discussion and Assessment | 2018-06-21 |
| Update the wiki with all correction suggestions | 2018-06-28 |
| Hand in the prototype and user manual | 2018-06-28 |
</table>
- Cost
The cost management consists of the necessary material resources and the used work resources, which are displayed in the following.
- Work resources
Due to the circumstances of the project the work resources are free. To stay realistic the cost analysis has bees made, because one major part of the cost calculation should be the worker costs. They are calculated on the time of each task and the quantity of involved workers based on the Gantt chart.
<table Working cost> <caption>Working Cost 19 feb - 22 apr</caption>
| Name | Cost (€) | % |
|---|---|---|
| Sten | 2340 | 21 |
| Geert | 2040 | 19 |
| Charlotte | 2080 | 19 |
| Mireia | 2020 | 19 |
| Hervé | 2460 | 22 |
</table>
<figure WrkC>
 <caption> Working Cost </caption>
</figure>
<caption> Working Cost </caption>
</figure>
<table Working cost> <caption>Working Cost 23 apr - 21 jun</caption>
| Name | Cost (€) | % |
|---|---|---|
| Sten | 2460 | 23 |
| Geert | 1940 | 18 |
| Charlotte | 2020 | 19 |
| Mireia | 1900 | 18 |
| Hervé | 2350 | 22 |
</table>
<figure WrkC>
 <caption> Working Cost </caption>
</figure>
<caption> Working Cost </caption>
</figure>
- Material resources
Considering the budget of 100 € the team needs to monitor the material costs. Figure cost presents the necessary components with their quantity and price.
<table cost> <caption> Material cost </caption>
| Component | Quantity | Price (€) |
|---|---|---|
| Solar Panel | 1 | 4.80 |
| Battery | 1 | 6.75 |
| WiFi Module | 1 | 11.90 |
| Battery charger | 1 | 4.90 |
| DC-DC step up | 1 | 6.80 |
| Resistor 4.7 kΩ | 1 | 0.10 |
| Screws | Pack of 5 units | 1 |
| Inserts | Pack of 5 units | 1 |
| O-Rings | Pack of 5 units | 1 |
| Capacitor 470 µF | 1 | - |
| Sensors | ||
| Turbidity | 1 | 8.12 |
| Temperature | 2 | 7.30 |
| Material | ||
| ABS | - | |
| Rubber | 4.00 | |
| Cork | 4.00 | |
| Glue | - | |
| Total | 68.97 |
</table>
- Quality
The water Intelli-buoy will be sold as a product service system. For this reason the product and the service must be of high quality.
Product quality To provide our customers with a good product we have to use good materials and test our product. The designing and testing phases are very important to get a high quality product. In the designing phase it is important to don’t make the product too complicated and use the knowledge of experts. In the testing phase the product will be tested on water-tightness and the sensors will be tested. The test will be furthermore explained in chapter 7.8. After te designing and testing fase it is important to know if the supplier is reliable, so all the components will be tested by the delivery.
Usage quality Before going on the market it is important to do usability tests. With the usability tests we can see how users use the product and ask them what they think about the product and service. To provide the best service these usability tests will return annually.
Service quality Another important part is the service we want to provide. Besides of the maintenance of our buoys we want to give our clients advice about the plants they use in their natural swimming pool.
- People
A Responsibility Matrix (see Table RM) is used to define who in the team is responsible for individual work elements and deliverables. By forming a matrix with the WBS, responsibilities can be assigned to lower level tasks. In the table there are some initials used, meanings are: P= Participant A= Accountable R= Responsible I= Inform S= Sign C= Consultant
<table RM> <caption> Responsibility Matrix </caption>
| Task/People | Sten | Geert | Charlotte | Mireia | Hervé | Supervisors |
|---|---|---|---|---|---|---|
| Task identification and allocation | P | P | R | P | P | A,C |
| Gantt chart | R | P | P | P | P | A,C |
| Blackbox diagram | R | P | P | P | P | A,C |
| Technical research | P | P | R | A,C | ||
| Market research, existing products | P | R | P | P | P | A,C |
| Initial budget planning | P | R | P | A,C | ||
| Specific plan | R | P | P | P | R | A,C |
| Business plan | P | R | R | P | P | A,C |
| Final schemes, diagrams | R | I | I | I | P | A,C |
| List of materials | P | I | I | I | R | A,C |
| Interim presentation | P | P | P | R | P | A,C |
| Interim report | P | P | P | R | P | A,C |
| Prototype construction hardware | P | I,P | P | R | P | A,C |
| Prototype construction software | R | I,P | P | P | P | A,C |
| Prototype assembly | P | R | P | P | P | A,C |
| Prototype functional tests | A | A | A | A | R | A,C |
| Final report | P | R | P | P | P | A,C |
| Video | R | A,C | ||||
| Poster | R | A,C | ||||
| Manual | R | A,C |
</table>
- Communications
An important part of a project is communication, bad communication can result in tension in the team. To prevent bad communication a communication matrix is made (see Table CM). This communication matrix shows how the communication is organized in the team. To communicate when the team is not together the team uses Google Drive and a WhatsApp group. Besides of that the team has a weekly team meeting and a weekly meeting with the supervisors.
<table CM> <caption> Communication matrix </caption>
| What | Who | Why | When | How |
|---|---|---|---|---|
| Deliverables | Responsible person | Development of the project | On the deadline | Uploading to Wiki |
| Team meetings | The team | To update each other about the progress of the project | Weekly | Face-to-face |
| Meetings with supervisors | The team | To update the supervisors about the progress of the project | Weekly on Thursday | Face-to-face with a presentation |
| Agenda | The team | To inform the supervisors about the subject to discus | 24 hours before the weekly meeting with the supervisors | Uploading to Wiki |
| Interim presentation | The team | To get feedback from the supervisors and other students on our project | 19-4-2018 | Oral presentation |
</table>
- Risk
During the project some problems can appear which could have influence on the progress of the project. Risks are events that might happen and that have an impact on the project. If the team doesn’t monitor the risks they will only see the consequences and impact. In table RA the risks are shown. In this table you can see the reason, impact and probability of each risk. It also shows the strategy chosen to handle these risks.
Explanation scaling:
1= Low
2= Medium
3= High
Explanation strategies:
Accept: Accepting the risk and do nothing
Transfer: Transfer the risk to someone else
Avoid: Eliminate the risk
Mitigate: Decreasing probability or impact
<table RA> <caption> Risk analysis </caption>
| Description | Cause | Owner or responsible | Impact | Probability | Rank | Strategy |
|---|---|---|---|---|---|---|
| Design fase | ||||||
| 1. Wrong dimensioning | Misunderstanding between team mebers | Hervé | 2 | 1 | 2 | Avoid |
| 2. Missing a component | Not enough knowlegde in the team, not listening to the supervisors | Sten | 1 | 1 | 1 | Mitigate |
| Production fase | ||||||
| 3. Components are to late | Supplier didn't hold the delivery time, product is out of stock | Geert | 2 | 2 | 4 | Avoid |
| 4. Components do not fit | Drafts were wrong | Mireia | 3 | 1 | 3 | Mitigate |
| 5. 3D printing goes wrong | To complicated model, too cheap material. | Charlotte | 3 | 2 | 6 | Avoid |
| 6. Components are broken | Bad quality components, components are broken because of the transport | Mireia | 2 | 2 | 4 | Transfer |
| 7. Software doesn't work | Not enough knowledge and time about programming. | Sten | 2 | 3 | 6 | Mitigate |
| Testing fase | ||||||
| 8. Sensors aren't working | Electrical scheme wasn't right, sensors were broken delivered | Geert | 1 | 2 | 2 | Mitigate |
| 9. Model is not watertight | Too complicated model, too cheap material | Hervé | 3 | 3 | 9 | Avoid |
| 10. Losing data code | Computer problem | Charlotte | 2 | 1 | 2 | Transfer |
</table>
Table Rm shows the risk matrix, in this table the risks are ranked on their impact and probability. With the use of a risk matrix, management becomes easier and more organized, allowing the project team to prioritize risks and handle them more effectively.
<table Rm>
 <caption>Risk matrix</caption>
</table>
<caption>Risk matrix</caption>
</table>
Biggest risks
A risk matrix has been created in Table Rm and it has been shown that there are three risks that could have a critical impact. These three risks and the chosen strategies on these risks will be explained.
9. Model is not watertight
The water intelli-bouy will spend its technical lifetime mostly in water, that’s the reason that our product has to be watertight. When the product is not completely watertight the electrical parts in the product will break and can’t be used anymore. If this risk will appear it will result in a big delay because the product has to be developed over and new electrical parts will be needed. The strategy that will be chosen here is the avoiding strategy. With this strategy the risk will be eliminated. This risk can be eliminated by using good (water resistance) materials and if the model is not that complicated. Besides of that we have to use the knowledge of experts in this area, for example experts at 3D printing.
7. Software doesn’t work
When the software doesn’t work the product can’t be tested and that can result in a delay of the project. When there is not enough knowledge in the team or the team didn’t planned enough time to do it the software probably won’t work. The strategy that is chosen here is to mitigate the problem, with this strategy the impact or probability will be decreasing. To decrease the impact or probability the team has to start in time on the programming part and use the knowledge of programming experts. When the software doesn’t work the team has to contact experts prematurely.
5. 3D printing goes wrong
If the 3D printing goes wrong we have to print the product again, this will result in a delay. This risk can appear because the model is too complicated or that the materials aren’t good enough. The strategy that is chosen here is to avoid the problem. This risk can be eliminated by using the knowledge of experts before printing and using water resistance materials.
Review of the Risk analysis
After the analysis the team was more secure about the impact of several tasks and handled them with more care. Most of the risks didn’t appear, but unfortunately the team had some issues with the 3D module, which were not covered in the risk analysis. The module had to be redesigned several times and therefore the module was not ready in the expected time. The problem was a slow communication between too many involved people. Nevertheless the changes in size and connection of the module were made and the prototype could still be printed in time.
- Procurement
Procurement is buying the goods and services your company needs on time, of the best quality and at the best price. It is important to know how to buy, where to buy and from whom to buy. When a company is able to manage their procurement well it will add value to all the business practices and saves time and money [46].
<figure ProcurmentM>
 <caption>Natural pool [47]</caption>
</figure>
<caption>Natural pool [47]</caption>
</figure>
When the company needs goods/services, the company’s needs must be identified in order to choose which type of service or product will fit best. Then the buyer needs to find them at the best quality for the best price while also making sure the supplier is able to deliver. To achieve the best conditions regarding prices, terms and delivery, the company needs to negotiate with suppliers. If both parties, the buyer and the supplier, agree on all terms (pricing, delivery, quality, etc.) the company can make it official by signing a contract. Throughout the delivery process, the products and services needs to evaluated to ensure they are what the company had planned to buy, they meet your quality standards, they arrive on schedule and you are charged the prices outlined in the contract. Once the project is complete, it is essential to analyse the process and evaluate its success as well as record observations for future projects [48].
- Stakeholders management
A stakeholder is a person, group or organization that has interest or concern in an organization. Stakeholders can affect or be affected by the organization's actions, objectives and policies. The stakeholders of this team are shown in the stakeholders analysis (see Table SA). This table shows the power and influence of the stakeholders.
<table SA> <caption> Stakeholders analysis </caption>
| Who | Role | Power | Influence |
|---|---|---|---|
| 1. The team | Developers | High | High |
| 2. ISEP | Sponsor | High | Low |
| 3. The Supervisors | Controllers | High | Medium |
| 4. Suppliers | Providing materials | Low | Low |
| 5. Competitors | Competition | Low | Medium |
| 6. Consumers | Buying products | Low | Low |
</table>
Figure Sm shows the stakeholders matrix. This matrix shows how to handle the stakeholders.
<figure Sm>
 <caption>Stakeholders matrix</caption>
</figure>
<caption>Stakeholders matrix</caption>
</figure>
- FLAP Analysis
As a postmortem analysis, the team has chosen the FLAP analysis (see figure flap). It offers an easy way to visualize the positive and negative things of the project. FLAP is an acronym for:
- Future Considerations: Includes future considerations with respect to the project.
- Lessons Learned: Includes the key lessons and takeaways from the project.
- Accomplishments: The key accomplishments for the project.
- Problem Areas: Includes problem areas experienced throughout the project.
<figure flap>
 <caption>FLAP analysis</caption>
</figure>
<caption>FLAP analysis</caption>
</figure>
- Conclusion
This study allowed the team to define the limits of the project but also to determine an optimal management strategy. The team fulfilled the objectives, namely the multicultural teamwork and building a floating buoy to measure the quality of the water, successfully. By making a risk analysis the team was able to minimise the risk. Unfortunately there were some issues with the 3D model that were not covered. In the future there will be more time planned for the design phase to prevent these problems. The most successful part of the project was the clear structure of the scope without too many changes. This might be reasoned by the early analysis of the people, cost, risk and communication strategies.
- Marketing Plan
- Introduction
Marketing isn’t just about selling your product, it’s about selling benefits. This chapter is used to find this benefits and make a marketing strategy. To discover the market a market analysis will be made, these market analysis will result in a SWOT analysis. Besides of the market it is important to identify your future customers to know who they are and how to reach them. Eventually the team will use the 4P model to make our marketing strategy.
- Market Analysis
The market analysis can be divided in the internal and external analysis. The internal analysis describes the Micro-environment and the external analysis describes the Meso- and Macro-environment (see Figure MA). The internal and external analysis will provide input for the SWOT analysis.
<figure MA>
 <caption>Market Analysis [49]</caption>
</figure>
<caption>Market Analysis [49]</caption>
</figure>
- Internal Analysis
The 7s model of McKinsey will be used to make the internal analysis (see Figure 7sM). The internal analysis will results in the weaknesses and strengths of this team.
<figure 7sM>
 <caption>7s Model [50]</caption>
</figure>
<caption>7s Model [50]</caption>
</figure>
Strategy
We are a team without team roles where everybody is the same and use everybody’s experiences and capabilities to finish this project with a good grade.
Structure
In our team there are no team roles, this means that there is no hierarchy. Every team member has the same role and communicate with every other team member. Important decisions are made in meetings where we want to achieve consensus about every subject.
Systems
Every Thursday there is an meeting with the supervisors who give us feedback about our project. Besides of that meetings we have a standard team meeting on Thursday to prepare the meeting with the supervisors and to discuss important subjects. To store our documents we use Google-Drive, this gives us also the possibility to work together on the same document at the same time.
Style
We don’t have a leader in our team, what means that we have a flat structure. At the beginning of the project we allocated the subjects to the team members, this means that every team member has an responsibility about a different subject. Besides of that every team member helps each other when needed or asked.
Staff & Skills
All the team members of this team have a different field of study. The fields of study are: Charlotte Imenkamp: Biomedical Engineering, Hervé Houard: Product Development, Mireia Estruga Colén: Mechanical Engineering, Geert van Velthoven: Industrial Engineering and Management, Sten Pajula: Electrical Engineering.
Shared values
A motivated and multicultural team with different educational background who want to finish this project with a good grade.
- External Analysis
To make an external analysis the Five Forces model of Porter and the PESTEL analysis will be used. The external analysis will result in the opportunities and threats of the market.
- PESTEL analysis
<figure PESTELAnalysis>
 <caption>PESTEL Analysis [51]</caption>
</figure>
<caption>PESTEL Analysis [51]</caption>
</figure>
Political & Legal
A recent study for the BC Ministry of Health Planning found that physical inactivity costs the British Columbian health care system 211 million dollar a year in direct healthcare costs. The same study concludes that if 10% more British Columbians were physically active the province could directly save an estimated 18.3 million dollar every year in prevented healthcare costs, plus an added 31.1 million dollar in productivity gains.[52]
Economical
While the investment costing is largely dependent on final layout and scope, it is generally regarded that natural pools cost more to construct than conventional pools. This is mainly due to the need to construct two pools (swimming basin and regeneration zone) and plant matter used for filtration. The investment may be higher but the maintenance cost of natural swimming pools are lower. The reason for this is that traditionally outdoor pools are difficult to maintain and justify in comparison with natural swimming pools. Besides of that there is less energy needed to filter the water and there are no chemicals needed.
Social
The first natural pools appeared in Austria and Germany in the 1980’s. There has since been a rapid increase in numbers, with over 20,000 public and private natural pools now in Europe. The first North American public natural swimming pool opened in Minneapolis, Minnesota in July 2015. The increasing number of natural swimming pools across Europe and North America are receiving growing exposure and public presence, which is expected to result in an increase in public demand in the near future. Research have showed evidence that aquatic programs contribute to physical and emotional well-being of the community. Evidence has indicated that regular aerobic exercise can decrease the risk of chronic illnesses, and that water-based exercise is proven to improve mental health by decreasing depression and anxiety, in addition to encouraging social connections across varied demographics.
Technical
A natural swimming pool still requires testing procedures to track and ensure water quality, yet chemical treatment purchases are eliminated, mechanical and electrical pumping requirements are minimized and water is continually recycled – eliminating the risk of chemically treated water being released into municipal water systems.
Environment
Besides increasing green space and providing a visually pleasing natural setting created by the planting in the regeneration zone, natural pools eliminate concerns over chlorinated water run-off into municipal sewers, therefore lessening the amount of chemicals entering the water system. Furthermore, planted regeneration zones provide a thriving habitat for insects and amphibians. A biological treatment system with a balanced ecosystem can improve water quality and visual experience through enhancing the natural habitat and surroundings.
- Porters Five Forces
<figure Porterfiveforces>
 <caption>Porter five forces [53]</caption>
</figure>
<caption>Porter five forces [53]</caption>
</figure>
Threat of new entrants
The threat of new entrants affects the competitive environment for the existing competitors and influences the ability of existing firms to achieve profitability. For example, a threat of entry could be that competitors feel attracted to the profits of our industry and they want to take advantage of this fact and enter in the market like new competitors. This could either threaten and also decrease the market share and profitability of existing competitors and result in changes to existing product quality or price levels. There exist several factors that determine the degree of the threat of new entrants to an industry. These factors are called barriers to entry and they make it difficult for new businesses to begin operating in the market. For new entrants it is not hard to entry this market, because there aren’t a lot of barriers. New entrant don’t need a big investment to produce this product and there is no new technology used.
Bargaining power of suppliers
Supplier power is one of the factors to consider when you are analysing the structural environment of an industry using Porter’s five forces framework. For the water Intelli-bouy there is no new technology needed, the components can be bought at almost every technical-shop. For this reason the power of the suppliers is very low. It is also easy for us to switch to another supplier.
Bargaining power of customers
The bargaining power of customers refers to the pressure consumers can exert on companies to provide higher quality products, better customer service and lower prices. We want to be a company totally dedicated to our clients with a company policy that is adequate to satisfy them and that also provides a pleasant customer service, return service, guarantee and other services necessary to earn their trust. In this market the power of the customers is limited because there are not many companies who sell this product. It is for a customer difficult to switch to another company whit the same product and service.
Threat of substitutes
This force is referred to the availability of a product that the consumer has in the market, that is to say, the opportunity of purchase another product of another company that offers similar benefits instead of our product. The threat of substitution in an industry affects the competitive environment for the firms in that industry and influences those firms’ ability to achieve profitability. As we said in the chapter of the State of the Art, there already other water Intelli-buoys, especially in markets of industrial/ scientific buoys and of consumer products. But there is no exciting product in this niche that focuses on natural swimming pools to measure the quality of the water.
Competitive rivalry within an industry
Nowadays, society is very aware of the importance of the environmental impact. We want to get involved in this cause and achieve the highest efficiency always with the least possible damage to the planet during the production process. As we said before, we do not have any competitors in our niche yet and for this reason there is no competence to worry about. We want to be foresighted since the beginning and make the difference from an adequate ethical and moral point of view and everything that this encompasses: sustainability, recycling, good marketing… The intensity of rivalry among competitors in an industry refers to the extent to which firms within an industry put pressure on one another and limit each other’s profit potential. High intensity of competitive rivalry can make an industry more competitive and decrease profit potential for the existing firms.
- SWOT Analysis
Now that the market analyses are made the SWOT Analysis can be filled in (see figure SWOT). The strengths & weaknesses are filled in based on the internal analysis and the opportunities & threats are filled in based on the external analysis.
<figure SWOT>
 <caption>SWOT Analysis</caption>
</figure>
<caption>SWOT Analysis</caption>
</figure>
Strengths
The team members all have different educational background, so each team member has its own expertise to contribute on the project. All the team members are ambitious and willing to help each other to receive a good grade. Besides of that there is a panel of supervisors who helps us when asked. The strength of the product is providing a service to our consumers. The product gives consumers advice about the filtration system and information which plants can be used to filter the water.
Weaknesses
A weakness of this team is that everyone has a different language, this can result in misunderstanding. Another weakness is that all the team members are not diehard engineers and that there is limited time and budget to fulfil this project. Compared to some other companies we only have three sensors to measure the quality of the water.
Opportunities
One of the big opportunities in this market is the increasing popularity of natural swimming pools and popularity of Product Service Systems. This can result in a growing market and more sales opportunities. Besides of that there are almost no direct competitors who sell the same product or service in this niche.
Threat
To only threat in this market is that it’s easy to enter this market because there is no high investment needed or new technologies used.
- Strategic Objectives
Strategic objectives are statements that indicate what is critical or important in your organizational strategy. In other words, they’re goals we’re trying to achieve in a certain period of time, typically 3-5 years. The objectives have to be SMART: Specific, Measurable, Achievable, Realistic and Timed. Team 2 have the following objectives:
- Build a working water Intelli-buoy before 14 June 2018
- Make an application for the water Intelli-buoy before 14 June 2018
- Improve customer satisfaction with 15% before 1 December 2018
- Invest 5% of the profit in innovation before 1 July 2019
- Increase recycling of the product by 10% before 1 July 2019
- Reduce waste by 20% before 1 August 2019
- Use more sensors in the water Intelli-buoy before 1 September 2020
- Increase market share to 5% in Europe before 1 June 2021
- Segmentation
The team is going to sell the water Intelli-buoy to the B2C market, which means the business to consumer market. It is not possible to focus on the globally market, so the team have to make an decision on which segments they want to focus. The markets will be segmented geographical, demographical and psychological.
- Geographic
<figure Global>
 <caption>Natural Pools Globally [54]</caption>
</figure>
<caption>Natural Pools Globally [54]</caption>
</figure>
Figure Global shows that Europe has the most natural pools globally. There is an increasing amount of natural pools in Europe, so for this reason the team chose to focus on the European market.
- Demographic
The team thinks the most natural pools are located in south European countries. In the south of Europa there are also a lot of holiday homes with swimming pools. Because it is not sure which country has the most natural pools the team will chose a country based on the income and amount of holiday homes. Table DEMO shows the income per country in 2018.
<table DEMO> <caption> Average Salary Europe [55]</caption>
| 2018 | 2017 | |||||
|---|---|---|---|---|---|---|
| Rank | Country | Gross (€) | Net (€) | TAX (%) | NET | % |
| 1 | Denmark | 5,191.00 | 3,270.00 | 37.01 | 3,095.00 | 5.35 |
| 2 | Luxembourg | 4,412.00 | 3,159.00 | 28.40 | 3,009.00 | 4.75 |
| 3 | Sweden | 3,340.00 | 2,570.00 | 23.05 | 2,465.00 | 4.09 |
| 4 | Finland | 3,380.00 | 2,509.00 | 25.77 | 2,509.00 | 0.00 |
| 5 | Ireland | 3,133.00 | 2,479.00 | 20.87 | 2,464.00 | 0.61 |
| 6 | Austria | 3,632.00 | 2,324.00 | 36.01 | 2,009.00 | 13.55 |
| 7 | Germany | 3,703.00 | 2,270.00 | 38.70 | 2,270.00 | 0.00 |
| 8 | France | 2,957.00 | 2,225.00 | 24.75 | 2,157.00 | 3.06 |
| 9 | Netherlands | 2,855.00 | 2,155.00 | 24.52 | 2,263.00 | -5.01 |
| 10 | United Kingdom | 2,498.00 | 1,990.00 | 20.34 | 2,102.00 | -5.63 |
| 11 | Belgium | 3,401.00 | 1,920.00 | 43.55 | 2,091.00 | -8.91 |
| 12 | Italy | 2,534.00 | 1,758.00 | 30.62 | 1,762.00 | -0.23 |
| 13 | Spain | 2,189.00 | 1,749.00 | 20.10 | 1,718.00 | 1.77 |
| 14 | Cyprus | 1,779.00 | 1,658.00 | 6.80 | 1,658.00 | 0.00 |
| 15 | Slovenia | 1,626.00 | 1,062.00 | 34.69 | 1,074.00 | -1.13 |
| 16 | Malta | 1,379.00 | 1,021.00 | 25.96 | 1,021.00 | 0.00 |
| 17 | Estonia | 1,221.00 | 957.00 | 21.62 | 945.00 | 1.25 |
| 18 | Portugal | 1,158.00 | 925.00 | 20.12 | 984.00 | -6.38 |
| 19 | Greece | 1,092.00 | 917.00 | 16.03 | 947.00 | -3.27 |
| 20 | Czech Republic | 1,149.00 | 873.00 | 24.02 | 837.00 | 4.12 |
</table>
Based on the income and amount of natural pools Germany is the best country to start selling the water Intelli-buoy. Countries like Denmark and Sweden also have a lot of potential because they have a lot of holiday homes in southern European countries and a high income.
- Gender: all
- Age: 24-70
- Family situation: have children
- Interest: swimming
- Income: average or high
- Psychological
For the psychological segmentation it is important that people care about a healthy lifestyle and the environment. Swimming is good for the physical health and for natural swimming pools there are no chemicals needed.
- Strategy/Positioning
Now that the analyses are done it is time to make strategic choices. Strategic choices can be made in two point of views: inside-out and outside-in. The team choses for the outside-in strategy. With this strategy you identifies the opportunities of the market and how to take advantage of them. As a theoretical basis, we use the three different strategies a company can chose according to Porter for a outside-in strategy.
- Cost leadership strategy
- Differentiation strategy
- Focus strategy
The team choses the focus strategy, with a focus strategy you choose to concentrate on one or a few segments in the total market. By choosing one or more segments you are often better informed of the needs and wishes of the customer than in the other strategies. Within a focus strategy you can chose for a focus on differentiation or cost leadership.
By making a perceptual map it will help you to choose your positioning strategy. The perceptual map is a map where the competitors and your company are compared according to two different factors. The purpose of the map (see figure Perceptual) is to recognize what is already on the market and what can be a potential market.
<figure Perceptual>
 <caption>Natural Pools Globally </caption>
</figure>
<caption>Natural Pools Globally </caption>
</figure>
Based on figure Perceptual the team decided to choose the cost leadership strategy in the focus market. The reason for this choice is because the pHin and Seneye Pond have more sensors and a higher price. By using a lower price it is possible to achieve a larger market share.
- Adapted Marketing-Mix
To complete the Marketing-Mix the 4P’s will be filled in. Figure MM shows the marketing mix with the Product, Price, Place and Promotion.
<figure MM>
 <caption>Marketingmix</caption>
</figure>
<caption>Marketingmix</caption>
</figure>
Product
The water Intelli-buoy will help owners of a natural swimming pool measure the quality of the water in an easy and efficient way. The water Intelli-buoy contains three sensors: an air temperature sensor, water temperature sensor and turbidity sensor. High water temperature could indicate a low level of oxygen in the water, what can results in dying plants. Also a high level of turbidity can indicates the presents of algae’s, which are also bad for the plants. All these parameters are displayed in the corresponding application and gives the costumer notifications when one of the parameters are too high.
The water Intelli-buoy will be offered as a service, this means that costumers don’t buy the product but pay a monthly fee. To compete with the existing products on the market the costumers will be provided with advice about the plants they could use for their swimming pool. When there is something wrong with the product the customers can send it back to the company and receive another one. In this way it is also better possible to recycle the products after usage.
Price
In the state of the art the competitors are also compared on the prices. The prices vary between 34 € to 210 €. The price of the water Intelli-buoy will be around 150 €, when components, materials and working hours are calculated. The water Intelli-buoy will be sold as a Product Service and the monthly fee will be around 15 €, this is almost the same fee as the pHin (20 €). The consumers can chose for a one-year contract or a two-year contract. When a consumer choses for a one year contract the monthly fee will be around 30 €.
Place
The water Intelli-buoy can be bought on the website. The product is first available in Germany, because that is the first market we want to focus on. After that we will try to focus on the Danish and Swedish market. It is important to keep in mind that the distribution needs to be well covered to be able to sell the product as a service.
Promotion
At first we want to promote the product on the most used social media platforms, like Facebook and Instagram. After that we want to try to collaborate with companies who build natural pools. In this case the consumer is able to buy the water Intelli-buoy while buying a natural swimming pool.
- Budget
Table Mbudget shows the dividing of the marketing budget. To reach as many people as possible all the advertisement will be online. The Facebook, Instagram and Google advertisements are paid by clicks. This means when the budget is achieved the advertisement is not visible anymore. To provide the customers of the best service possible the team will spend 1500 € to create a good website and customer service.
<table Mbudget> <caption> Marketing budget </caption>
| Action | Price (€) |
|---|---|
| Facebook advertisement | 1200 |
| Instagram advertisement | 1000 |
| Google advertisement | 1000 |
| Website | 1500 |
| Total | 4700 |
</table>
- Strategy Control
PDCA is an iterative, four-stage approach for continually improving processes, products or services, and for resolving problems. It involves systematically testing possible solutions, assessing the results, and implementing the ones that are shown to work. The four phases are:
- Plan: identify and analyse the problem or opportunity, develop hypotheses about what the issues may be, and decide which one to test.
- Do: test the potential solution, ideally on a small scale, and measure the results.
- Check/Study: study the result, measure effectiveness, and decide whether the hypothesis is supported or not.
- Act: if the solution was successful, implement it.
These stages are illustrated in Figure PDCA, below:
<figure PDCA>
 <caption>PDCA Circle [56]</caption>
</figure>
<caption>PDCA Circle [56]</caption>
</figure>
To keep the customers satisfied there will be a monthly survey, in this way the customers can give their feedback about the product and some new input. Besides of that it is important to check if the targeting group is reached, otherwise there must be a market research how to reach the targeting group.
- Conclusion
Based on this market/economic analysis, the team decided to create the water Intelli-buoy who informs people about the quality of the water intended for natural pools because there are not a lot of competitors in this niche. Consequently, the team decided to create a product with an air temperature sensor, an water temperature sensor and turbidity sensor. The water Intelli-buoy will be sold as an product-service where costumers pays a monthly fee. The service consist of advising the consumer of which plants they can use to have the best quality of the water which is showed in the application. The buoy should be sold through the Internet, targeting families with natural swimming pools, wishing to easily estimate water quality. These customers will pay a monthly fee around 20 €
- Eco-efficiency Measures for Sustainability
- Introduction
In the folowing chapter we deal with the definition of two concepts: sustainability and eco-efficiency. The idea of sustainability stems from the concept of sustainable development which became common language at the World's first Earth Summit in Rio in 1992. “Development that meets the needs of the present without compromising the ability of future generations to meet their own needs” – Bruntland Report for the World Commission on Environment and Development [57]. Eco-efficiency generates more value through technology and process changes whilst reducing resource use and environmental impact throughout the product or service's life [58]. Critical aspects of eco-efficiency are:
- A reduction in the material intensity of goods or services
- A reduction in the energy intensity of goods or services
- Reduced dispersion of toxic materials
- Improved recyclability
- Maximum use of renewable resources
- Greater durability of products
- Increased service intensity of goods and services
This chapter includes our research on the three pillars of sustainability. As is shown in Figure bpt1. the three main features are overlapping; Economic sustainability, Social sustainability, Environmental sustainability. Indicating that the three pillars of sustainability are not mutually exclusive and can be mutually reinforcing. They are interdependent and in the long run none can exist without the others.
<figure bpt1>
 <caption>Economic, Social and Environmental sustainability[59]</caption>
</figure>
<caption>Economic, Social and Environmental sustainability[59]</caption>
</figure>
- Environmental
We all know what we need to do to protect the environment, whether that is recycling, reducing our power consumption by switching electronic devices off rather than using standby, by walking short journeys instead of taking the bus. Businesses are regulated to prevent pollution and to keep their own carbon emissions low. There are incentives to installing renewable power sources in our homes and businesses. Environmental protection is the third pillar and to many, the primary concern of the future of humanity. It defines how we should study and protect ecosystems, air quality, integrity and sustainability of our resources and focusing on the elements that place stress on the environment. It also concerns how technology will drive our greener future.
- Economical
Economical issues are the most problematic and builds most tensions between parties to find an economical, but still sustainable solutions [60]. It’s also about providing incentives for businesses and other organisations to adhere to sustainability guidelines beyond their normal legislative requirements. Also, to encourage and foster incentives for the average person to do their bit where and when they can; one person can rarely achieve much, but taken as a group, effects in some areas are cumulative. Economic development is about giving people what they want without compromising quality of life, especially in the developing world, and reducing the financial burden of doing the right thing.
- Social
There are points in this area. Most important is awareness of and legislation protection of the health of people from pollution and other harmful activities of business and other organisations [61]. In North America, Europe and the rest of the developed world, there are strong checks and programmes of legislation in place to ensure that people's health and wellness is strongly protected. It is also about maintaining access to basic resources without compromising the quality of life. The final element is education - encouraging people to participate in environmental sustainability and teaching them about the effects of environmental protection as well as warning of the dangers if we cannot achieve our goals [62].
- Life Cycle Analysis
Life cycle analysis are made to understand how big impact a product has on the environment from the first ideas of the product til the discarding it by consumer. The analyse will go through five different steps from designing to recycling. The detailed analyse is not made in the proccess of the project, it’s just thought through and made aware off by the team.
<figure bpt>
 <caption>Life Cycle Analysis[63]</caption>
</figure>
<caption>Life Cycle Analysis[63]</caption>
</figure>
- Resources
For the prototype (and product), the team wants to use PVC due it’s suitable properties in our products environment. PVC (polyvinyl chloride), sometimes known as ‘vinyl’, is a thermoplastic material made of 57% chlorine (derived from industrial grade salt) and 43% carbon (derived predominantly from oil / gas via ethylene). PVC is inexpensive to make, requires minimal maintenance when in use, and is extremely durable (it is commonly used to make long-lasting products, often with a life-expectancy exceeding 60 years). Thanks to its unique polymer structure, PVC products are well suited for recycling when they come to the end of their life.
- Manufacturing
The whole manufacturing proccess is done by automated machines. The waste of manufacturing proccess have to be minimal to meet our vision of sustainability. Since our product life-cycle sees its final product to return to factory for recycling, we are minimizing the waste of our product by having the whole control over the products life-cycle. Factory’s efficency has to be maximized by monitoring all the waste, production and labor work. The quarterly done reports of latter values, will determine the factorys efficiency, sustainability and adress the neccesary actions for improvements.
- Storage
Storing and distributing the product around the world for target markets should be done the most cost-effective and efficient way. This involves a lot of collaboration with major logistic companys in Europe and beyond. We will bring distribution centres as close to the customer as possible and we’d prefer rail and inland shipping to trucks, which is eight times less carbon intensive [64].
- Retail
Product retailing is only considered online, then we don’t need to use the labor intensive work and costs of retailing are kept minimal.
- Use
When product is shipped and delivered to the client, it’s ready to be set up by client to use. The software is updated regurarly, when neccesary problems emmerge, updates can be applied to a system. Hardware updates are implemented every 1-2 years, when more efficient techologies surface.
- Recycle
PVC compounds are 100% recyclable physically, chemically or energetically. After mechanical separation, grinding, washing and treatment to eliminate impurities, it is reprocessed using various techniques (granulated or powder) and reused in the production.
There are two principal ways of recycling PVC:
Mechanical recycling: PVC waste is ground into small pieces that can be easily processed into new PVC compounds ready to be melted and formed into new products. Feedstock recycling: PVC waste is broken right back down into its chemical molecules, which can be used again to make PVC or other materials [65].
Our team opted to use the mechanical recycling, because it involves less chemicals and is therefore more ecofriendly.
- Conclusion
The chapter concludes the differences between sustainability and eco-efficiency. The three areas that a sustainable report should include are also defined - Environmental, the Economic and the Social areas. Because of this course the team performed brief life-cycle analysis of product and company in terms of the Environmental, Economic and the Social dimensions of sustainability. Taking all those aspects under consideration, team opted to offer costumer service, instead of product. That means, that client will return the product every now and then, when updates on hardware are made. Company will recycle the exterior and upgrade only the inside to reduce the waste and return the product to costumer.
- Ethical and Deontological Concerns
- Introduction
Nowadays it is highly important for a company to focus on ethical and deontological concerns. Ethical issues come up occasionally and the answer is not always easy to find. Regarding these issues the concern has to consider its duties to the community, to the employer/ client, to the profession and to the colleagues.
Even though every country has its own code of ethics they all are based on a common basis. Because the team wants to increase the market all around Europe we try to find this common basis. Besides the code there is an easy method to make correct decisions - ”the headline test”. The person in charge asks himself, if he feels comfortable seeing his actions reported in the news. This makes one automatically consider the consequences of the decision and its impact on his family or business.
The team always wants to challenge unethical behaviour. And one of the most important values to do so is trust. Therefore the basis of our work should be the “TRUST Model for ethical decision making”.
- Think about the situation objectively. This includes understanding the situation and the facts and identifying with this knowledge the real issue.
- Recognize and analyze motivations. Many unethical actions are reasoned by premature decisions. To avoid it we always want to ask for the reasons and motivations leading to the next step from us or the other opinion
- Understand the applicable laws, rules and policies. Because only by knowing the frameworks and standards you can consider all options. Another step that has to be taken is asking others for help.
- Satisfy the headline test. This test mentioned above is an easy way to detect unethical behaviour.
- Take responsibility for your actions. Even if to err is human, you still are accountable for your actions and have to act according to your choice.
In our project we act in several different areas and ethical issues are inherent in each field. Therefore our ethical concern should involve the engineering, sales and marketing, the environment and last but not least our liability to the customers [66].
- Engineering Ethics
Engineering is a profession, where the highest standards of ethical behavior are urgent. It has a big impact on the quality on the life of many people. Due to this influence the job requires honesty, impartiality, fairness and equity. Additionally its inherent to the job of an engineer to have the duty of protecting the public health, safety and welfare of the society.
Every member of the team has an engineering background. Considering this the group must attach a high priority to the engineering ethics. For our work we want to adhere to the code of ethics invented by the National Society of Professional Engineers (NSPE)[67]. It is divided into three different parts: The first part is about the fundamental canons, where six points of fulfilling the professional duties of an engineer are defined. This is followed by the rules of practise, which explain the duties in more detail. The last part deals with the professional obligation of an engineer.
Some of the rules attach greater importance for the team and we will consider these following particularly. We will only use properly licensed software and we will be attentive not to carrying out technical work without having the appropriate level of knowledge and training. We will act objectively and truthful in the report and use correct referencing and crediting to avoid plagiarism. We will accept assignments and responsibility for them. We will acknowledge every error.
- Sales and Marketing Ethics
There are nearly as many different ways of marketing as there are products on the market. Finding the perfect marketing strategie is not easy, because the interests of companies and customers must be kept in balance. On the one hand companies compete for resources, customers and price to stay in the market and increase their gain. On the other hand customers demand the best quality for the cheapest price. Because of this harsh environment people sometimes forget about the importance of ethics in this field. But this problem makes the marketing and sales ethic even more important. With bad marketing the team would lose the confidence of the customer. But we want to achieve the opposite and build a stable and long term relationship of trust and faith. The team agreed on our three big marketing challenges:
- Promotion: The team will advertise the features of the buoy objectively and won’t present features that cannot be delivered. This is highly important because otherwise we would disappoint our customers and lose their trust.
- Price: Our price should cover all our costs including development, materials and production and to continue production and development it should of course make profit. Most importantly the price should be fair and transparent to the customer.
- Sales and product service: To promote the real advantages and maintain a good image we also need to focus on our employees. They represent the company by their behaviour and consequently they should be able to answer the customers questions satisfactorily and support the whole product.
These three tasks lead to the decision of the proper place of production. Even though the company needs to make profit the product will not be a low-cost production. With the choice of a factory in a country without a reasonable minimum wage a decrease in quality would be inevitable. This would violate the ethical rules of the team.
The group wants to discuss the ethics openly and honestly during all marketing decisions[68][69].
- Environmental Ethics
During the past two centuries the world population exploded from 1 billion up to over 7 billion inhabitants [70]. And unfortunately the consumption of resources grew with them. This behaviour gave increasingly severe stress on the life-supporting capacities of our planet and as a reason humans have to deal with the consequences like an increasing division between rich and poor and the several aspects of the climate change. The reason for this situation is that people forgot the value and the moral status of the environment and its nonhuman inhabitants. This is what environmental ethics are about. They deal with the balance between social, economic and environmental aspects and try to be more sustainable in all actions [71].
This is easier said, than done. The mindset of development needs to change and concerns ought to start providing more value with less environmental impact. They need to disconnect the growth of welfare of the use of natural resources and improve the economic and ecological efficiency.
Even though everyone has to take care of it in all their actions, the environmental ethics of a new product must be considered in more detail, because it could affect a wide range of customers. Therefore one big question for the project is: what can we do to degrade the impact of our product on the environment?
The first step in discussing the environmental ethics of a buoy is discussing the root of the product: the natural pool itself. The product should also attract new customers for natural ponds and the team supports the positive environmental aspects it includes. Due to the chemicals in the water of a normal pool, it has to be discharge into the sewer. With a natural pool there is no need for this. The pool functions in the same way as a natural lake and therefore there is no need for waste the water being discharged into the sewer. The same applies in the filtration system. The natural way reduces the energy consumption and the regeneration zones even offer an environment for animals like frogs, salamanders and (if wanted) fishes. This underlines the healthy ecosystem a natural pool provides [72].
Supporting this green environment the team plans to use renewable sources of energy for the product and wants to keep the water consumption for the production as low as possible. But it is necessary to start considering the environmental ethics with the beginning of the development. While working on the prototype the team will use as much components from local providers as possible. Another important challenge in environmental issues is the right choice of materials. It is inherent to materials to depend on natural resources. The most sustainable materials are the recycled ones. Therefore the team decides to use recyclable plastics. This includes the choice of not mixing different materials in one layer, because these can’t be recycled properly. Studying the live cycle analysis of the materials is a good way to get to know the materials and take the right decision. If we order materials or products from other suppliers we want to take care that they also meet our environmental and sustainable standards.
In the areas of recycling nothing will be left to chance. Consequently the team decides to offer the Product-Service-System, which gives the opportunity to evolve the product while it’s rented and take care of recycling by yourself. This brings the benefit of a comprehensive package for the costumer and the chance of taking care of the recycling of the product for the company.
To maintain the sustainability of the production and the decisions the team writes a sustainability report to choose the right materials. Additionally the team wants to document the environmental performance of their products.
- Liability
Indubitably the product should be prepared for the market after the development. This indubitably requires a liability analysis. There are two main areas of liability. The first one is civil liability, which covers public wrongs. There are obligations arising from torts or contractual relationships. For instance when a customer gets hurt due to the fault of our product, the company has to compensate for any damages and if necessary fund his care. The team commits to follow these tasks,if this case ever happens, but the main focus lies on avoiding a situation like this in the first place. The user manual will teach the customer how to handle the buoy properly and in case of a damage the customer is obliged to inform the company that it can be repaired by an expert.
The second area of liability is the professional one. The product must follow clear standards of safety, which are represented in five main EU Directives:
- Machine Directive (2006/42/CE 2006-05-17); [73]
- Low Voltage Directive (2014/35/EU 2016-04-20);[74]
- Radio Equipment Directive (2014/53/EU 2014-04-16);[75]
- Restriction of Hazardous Substances (ROHS) in Electrical and Electronic Equipment Directive (2002/95/EC 2003-01-27);[76]
- Electromagnetic Compatibility Directive (2004/108/EC 2004 12 15);[77]
At this point of developing the first four directives have no impact on our product. To have the future opportunity to evolve the product, team will follow and study all five directives.
Machine Directive: This directive applies, when components are joined together, from which at least one is able to move.
Low Voltage Directive: If the alternating current voltage is between 50 and 1000 V (75-1500 V for direct current) the low voltage directive applies. The reason of this directive are health and safety risks on electrical equipment. The team don’t expect to reach a voltage this high, but nevertheless it is important to know for future development.
Radio Equipment Directive: This covers an “electrical (…) product, which intentionally emits and/or receives radio waves for the purpose of radio communication and/or radiodetermination”. This does not apply on the WiFi module we use in the buoy.
Restriction of Hazardous Substances (ROHS) in Electrical and Electronic Equipment Directive: This directive restricts hazardous substances, which could harm human health and the environment, including the environmentally sound recovery and disposal of waste. These substances are for example Lead, Mercury or Cadmium. The team will take care that all the component parts follow these directive.
Electromagnetic Compatibility Directive: This directive is important for the project, because it deals with side effects between electronic components interfacing each other. These side effects can be electromagnetic radiation or fields in the surroundings of electronic components. The directive requires that “the electromagnetic disturbance generated does not exceed the level above which radio and telecommunications equipment (…)cannot operate” and “it has a level of immunity to the electromagnetic disturbance to be expected in its intended use which allows it to operate without unacceptable degradation of its intended use.” The team has to keep this in mind because otherwise the WiFi cannot work properly.
- Conclusion
After dealing with the ethical challenges more precisely the team has a better understanding of the issues which appear on the development of a product. The Team will respect all the subjects mentioned above and will always try to find the most ethical solutions by using the “trust model” as often as necessary. This model could help us to find the best solution in the engineering and sales and marketing ethics. One main concern of the team is the environmental ethics. We believe the buoy could help making natural pools more attractive and change the field of pools into a more sustainable one. Therefore the buoy itself has to be sustainable and especially follow the environmental ethics. Combined with the sustainability chapter it has again proved PVC to be the right decision of material. The sales and marketing ethics resulted in a clear vision of our advertising, price and employee.
Based on this analysis the next chapter explains the project development.
- Project Development
- Introduction
After the research on the State of the art chapter and the considerations of marketing, sustainability and ethics fields, we want to show the steps that we have followed to make and produce our prototype. In the followings chapters we are going to explain the project development, beginning with the black box to show the general structure of the system. This is followed by the architecture including the cardboard model, structural drawings with the final design and the electrical detail schematics.
- Blackbox
First of all, we did the Blackbox diagram (see figure bbd). This diagram shows inputs, outputs, components and power supply of the system.
<figure bbd>
 <caption>Blackbox diagram</caption>
</figure>
<caption>Blackbox diagram</caption>
</figure>
- Architecture
In this chapter we will see the evolution of our product starting with the cardboard model, followed by the first technical drawings of the prototype, the initial 3D model and also the electrical schematics to get a clearest idea of how the sensors and the electrical components work and better understand the functioning of the buoy.
- Look & Feel
To be able to come up with an attractive design for our product, that blends in the environment, we analysed the aesthetics of natural swimming pools. To help us better understand the look & feel of these pools, a mood board (Figure mb) was created. This gave us a good overall view of what values should be respected in our design. We finally could agree on the following adjectives: luxurious, natural, green, relaxing, balanced… With these adjectives in mind, we went on to make our first sketches.
<figure mb>
 <caption>Moodboard look & feel</caption>
</figure>
<caption>Moodboard look & feel</caption>
</figure>
- Cardboard Model
Cardboard Model was useful to have a real vision of how big our buoy would be. Only an external view because we did not add the components or the sensors in the model, but by doing it, helped us to choose the location of these. The following Figures cbm and cbm1 show different perspectives of the cardboard model.
<figure cbm>
 <caption>Cardboard model</caption>
</figure>
<caption>Cardboard model</caption>
</figure>
<figure cbm1>
 <caption>Another perspective of the cardboard model</caption>
</figure>
<caption>Another perspective of the cardboard model</caption>
</figure>
- Structural drawings
The following illustration (i3m) reflects a first draft of the buoy. It was created using the 3D modeling software Solidworks. This is how we would like the buoy to be, it reflects the look and feel of the environment the buoy will have to blend in.
<figure i3m>
 <caption>Initial 3D model </caption>
</figure>
<caption>Initial 3D model </caption>
</figure>
In the picture below (dimensions), we present a first idea of the general dimensions. This first draft will have to be refined further, until we obtain a detailed model, ready for production/ 3D printing. Several factors have to be kept in mind whilst doing this: water tightness, buoyancy, positioning of the components and many more.
<figure dimensions>
 <caption>Dimensions </caption>
</figure>
<caption>Dimensions </caption>
</figure>
- Final Design
We opted for this this open and clean design, which is shown in Figure br. By implementing the cork band, we try to implement a natural feeling. Besides the cork we chose to keep the rest of the product white for the following reason. Since there exists a great variety in natural pools, it was important to keep our product as neutral as possible. Aside from that, our product should inspire cleanliness. The general form of the buoy is elegant, open, balanced and discrete, this will allow it to blend into its environment without a problem.
<figure br>
 <caption> Buoy Render </caption>
</figure>
<caption> Buoy Render </caption>
</figure>
- Electrical Detail Schematics
The electrical schematics of our product features WI-FI controller, sensors and solar panel. Everything is made to be efficient and product is designed to be self-sustainable. The variety of sensor comes from the budget limitations.
<figure ph>
 <caption> Electrical schematic </caption>
</figure>
<caption> Electrical schematic </caption>
</figure>
- Components
In this chapter we will show the electrical components and the sensors that the buoy is made of as well their positioning.
- Electronic components
- Solar Panel
We have chosen this monocrystalline solar panel (Figure bbd), it is of high quality and has an exquisite appearance. It is used in all kinds of high quality electronic products such as solar cell phones, solar chargers, solar energy sources, etc. The material is resistant to deformation, high strength PCB board [78].
Price: 4.80 €
Supplier: ELECTROFUN
<figure bbd>
 <caption>Solar panel component [79] </caption>
</figure>
<caption>Solar panel component [79] </caption>
</figure>
Specifications:
- Power: 0.5 W
- Operating voltage: 5 V
- Operating current: 100 mA
- Open circuit voltage: 6 V
- Short-circuit current: 106 mA
- Dimension: 50 x 100 x 3 mm
- Operating temperature: -20 ℃ ± 85 ℃
- Wi-fi Module
This processor (see Figures mw) is an 80 MHz microcontroller with a full Wi-Fi and TCP/IP stack with DNS support. The Adafruit HUZZAH ESP8266 breakout is what it is designed to make working with this chip easy and a lot of fun [80].
Price: 11.90€
Supplier: BOTNROLL
<figure mw>
 <caption>Wi-fi module component [81]</caption>
</figure>
<caption>Wi-fi module component [81]</caption>
</figure>
Features:
- Reset boton
- Two diode-protected power inputs
- Red LED you can blink
- 3.3 V out, 500 mA regulator
- Two diode-protected power inputs
- Weight: 5 g
- Dimensions: 25 x 38 x 5 mm
- DC-DC step up
This is a LM2577 DC-DC power converter module with high precision potentiometer (Figure dcdc).
Price: 6.80 €
Supplier: ELECTROFUN
<figure dcdc>
 <caption>DC-DC step up[82]</caption>
</figure>
<caption>DC-DC step up[82]</caption>
</figure>
Specifications:
- Input voltage: 3 V - 32 V
- Output voltage: 4 V - 35 V
- Ultra high switching frequency: 400 KH.
- Dimensions: 43 x 21 x 14 mm
- Battery Charger Module
This is a battery charger module for lithium batteries (Figure cby), with LED indicator of charge and easy connection by micro USB cable, it allows the batteries to be recharged without the need to remove them from the circuit [83].
Price: 4.90 €
Supplier: ELECTROFUN
<figure cby>
 <caption>Battery charger module component [84]</caption>
</figure>
<caption>Battery charger module component [84]</caption>
</figure>
Specifications:
- Controller IC: TP4056 (datasheet)
- Operating voltage: 5 V
- Maximum load capacity: 1 A (adjustable)
- Cutting voltage at the output: 4.2 V +/- 1%
- Operating temperature: -10 ºC to 85 ºC
- Dimension: 26 x 17 x 5 mm
- Others: Micro-B USB connection and LED indicators
- Battery (BAT358)
This battery (Figure bat538) is a Lithium-Ion rechargeable battery. These batteries do not have a protective circuit, so if they are handled improperly they can burn, they can be used in all kind of tools taking into account the following specifications [85]:
Price: 6.75 €
Supplier: Electronic NIMO
<figure bat538>
 <caption> Lithium-Ion rechargeable battery [86]</caption>
</figure>
<caption> Lithium-Ion rechargeable battery [86]</caption>
</figure>
Specifications:
- Specifications Capacity: 2400 mAh
- Voltage: 3.7 V
- Technology: Li-Ion, SIN ct. of control
- Dimension: 18,0x65,0 mm
- Models: ICR 18650, with terminals
- Sensors
- Turbidity
The arduino turbidity sensor (Figure ts) detects water quality by measuring level of turbidity. It is able to detect suspended particles in water by measuring the light transmittance and scattering rate which changes with the amount of total suspended solids (TSS) in water. As the TTS increases, the liquid turbidity level increases. This arduino turbidity sensor has both analog and digital signal output modes. You can select the mode according to the MCU as threshold is adjustable in digital signal mode [87].
Price: 8.51 €
Supplier: DFROBOT
<figure ts>
 <caption>Turbidity sensor [88]</caption>
</figure>
<caption>Turbidity sensor [88]</caption>
</figure>
Specifications:
- Power: 0.5 W
- Operating voltage: 5 V DC
- Operating current: 40 mA (MAX)
- Response Time: <500 ms
- Weight: 30 g
- Insulation resistance: 100 min
- Operating temperature: 5 ºC - 90 ºC
- Temperature
The DS18B20 Temperature Sensor (Figure tts) is a digital electronic component developed to be applied in the most diverse environments, since it is able to measure the temperature in humid places (including under water), for this reason we chose it. For the temperature sensor to come into operation it is necessary to be connected to a prototyping platform, for example Arduino [89].
Price: 7.30 €
Supplier: ELECTROFUN
<figure tts>
 <caption>Temperature Sensor [90]</caption>
</figure>
<caption>Temperature Sensor [90]</caption>
</figure>
Specifications:
- Chip: DS18B20
- Operating voltage: 3-5.5 V
- Measuring range: 55 ºC - 125 ºC
- Accuracy: ± 0.5 ºC between -10 ºC and + 85 ºC
- Dimension of the cable: 100 cm
- Positioning of the components
Because a buoy is a floating object, we had to take stability and buoyancy into account when positioning the different components. To increase the stability, we placed the batteries at the bottom of the buoy, because the weight of the other components is not very significant, we have decided to place them above the waterline. This decision was made in order to minimise the risk of damaging some components if water intrusion should take place. The solar panel will be mounted on top of the buoy, to allow an optimum efficiency. Because of the flooded area between the upper and lower watertight compartments, a watertight channel was created between them. This allows us to safely run wires to and from the batteries.
<figure bbd>
 <caption>Positioning of the components</caption>
</figure>
<caption>Positioning of the components</caption>
</figure>
<table bbd> <caption>Power budget</caption>
| Component | Operating voltage (V) | Current (mA) | Power (W) | Dimensions (mm) | Weight (g) | Price (€) | |
|---|---|---|---|---|---|---|---|
| Consumption | |||||||
| ESP8266 WI-FI Wemos D1 Mini Pro 16M | 3.3 - 5 | 550 | 1.82 | 34.2 x 25.6 x 10.0 | 2.5 | 14.99 | |
| Turbidity sensor SEN0189 | 5 | 40 | 0.20 | 38.0 x 28.0 x 10.0 | 30.0 | 8.12 | |
| Temperature sensor DS18B20 | 3.3 - 5 | 1.5 | 0.0075 | 6.0 x 50.0 x 500.0 | 60.0 | 7.30 | |
| Temperature sensor DS18B20 | 3.3 - 5 | 1.5 | 0.0075 | 6.0 x 50.0 x 500.0 | 60.0 | 7.30 | |
| Power supply | |||||||
| DC-DC step up | 3.0 - 35.0 | 1000* | 43.0 x 21.0 x 14.0 | 8.0 | 8.40 | ||
| Charging module TP4056 | -0.3 - 8 | 1200 * | 5.04 * | 25.0 x 19.0 x 10.0 | 10.0 | 4.90 | |
| Battery | 3.7 | 2600* | 3.70 | 65.0 x 18.4 | 43.8 | 5.50 | |
| Panel | 5 | 100* | 50.0 x 100.0 x 3.0 | 3.80 | |||
</table>
* Under the “Power supply” the currents stated are maximum values, which one can produce or let through.
- Material selection
Four criteria were taken into account to make the right material choice for the Intelli-buoy:
- Water absorption rate
- UV-resistance
- Recyclability
- Price
In the Figure muc we can see a list of differents plastics and their respective properties. They are classified in a first stage, lowest to highest according the water absorption rate and then, their UV-resistance:
<figure muc>
 <caption>Material comparison </caption>
</figure>
<caption>Material comparison </caption>
</figure>
In the next table (table material) we can see more detailed the properties mentioned before [91] [92] [93] [94].
<table material> <caption>Material comparison</caption>
| Water absorption rate in % | UV resistance | |
|---|---|---|
| PCTFE | 0 | Good |
| ETFE | 0.007 | Good |
| FEP | <0.01 | Good |
| PTFE | <0.01 | Good |
| PPS | 0.02 | Good |
| PVDF | 0.02 | Good |
| PFA | <0.03 | Fair |
| PVC | 0.06 | Good |
| PBT | 0.08 | Fair |
| ECTFE | <0.10 | Good |
| PE | 0.1 | Fair |
| HDPE | 0.1 | Poor |
| LDPE | 0.1 | Fair |
| PET | 0.1 | Fair |
| PC | 0.15 | Fair |
| PETG | 0.2 | Fair |
| ABS | 0.3 | Poor |
</table>
These properties are important to us to design a robust product that can withstand the elements it will have to face. By looking at these two criteria the extensive list of plastic types could be narrowed down significantly.
To refine this list even further, we looked at the possibility and ease of recycling these different plastics. The following two materials came up as interesting options: HDPE (UV-stabilised), PVC.
The price of the raw material was the final and decisive criteria in this decision process. Since PVC is about 15-20% cheaper than HDPE, we chose to manufacture our buoy in PVC.
Prices average of last year (march 2017- march 2018): [95]
- HDPE: 0.60€/kg
- PVC: 0.49€/kg
Because we won’t be able to create our prototype by injection moulding, we won’t be able to use PVC. Instead we will be 3D printing our prototype using PLA.
- Polyvinyl chloride (PVC)
PVC is a thermoplastic made of 57% chlorine (derived from industrial grade salt) and 43% carbon (derived predominantly from oil / gas via ethylene). It is less dependent than other polymers on crude oil or natural gas, which are nonrenewable, and hence can be regarded as a natural resource saving plastic, in contrast to plastics such as PE, PP, PET and PS, which are totally dependent on oil or gas [96].
The PVC is the material we opted for our product, because of the benefits stated in the chapter of “Life Cycle Analysis”.
- Cork
Product features thin layer of cork for aesthetic reasons. The amount of cork used is insignificant compared to the PVC. Cork is harvested from the bark of the cork oak tree, found mostly in numerous Mediterranean countries, such as Portugal. That makes the logistics of materials cheaper for manufacturing process.
- Mathematical calculations
The mathematical calculations for this device are based in the Arquimedes principle (physical law of buoyancy) that was discovered by the ancient Greek mathematician and inventor Archimedes, this principle says that stating that any body completely or partially submerged in a fluid (gas or liquid) at rest is acted upon by an upward, or buoyant, force the magnitude of which is equal to the weight of the fluid displaced by the body. The volume of displaced fluid is equivalent to the volume of an object fully immersed in a fluid and the weight of the displaced portion of the fluid is equivalent to the magnitude of the buoyant force. The buoyant force on a body floating in a liquid or gas is also equivalent in magnitude to the weight of the floating object and is opposite in direction; the object neither rises nor sinks.
Therefore, to know if the buoy is able to float what we will do, follow the steps below:
- Calculate the total mass of the buoy (including the components): Wb
- Calculate the weight of the buoy: P = Wb • g
- Apply the Archimedes equation: Fe = V • g • ρ
- Checking if buoyant : F e > P
- Find and adapt the buoy G (Center of gravity) below B (Buoyancy center) to have a better stability
These are the data we know (some of the values shown below are taken from the Solidworks 3D modeling software):
Displaced mass of water: 545 g = 0.545 kg
Volume of the buoy: V = 285666 mm3 + 1004449 mm3 = 1290116 mm3 ≈ 0.00129 m3
Mass of the buoy: W = 291 g =0.291 kg
Water density: ρ = 1000 kg/m3
Gravity: g = 9.81 m/s2
Mass of the components:
<table weight> <caption>Mass of the Components</caption>
| Component | Mass (g) |
|---|---|
| ESP8266 WiFi Wemos D1 Mini Pro 16 M | 2.5 |
| Turbidity sensor SEN0189 | 30.0 |
| Temperature sensor DS18B20 | 60.0 |
| Temperature sensor DS18B20 | 60.0 |
| Charging module TP4056 | 20.0 |
| Battery | 43.8 |
| Panel | 10.1 |
| Sum | 226.3 |
</table>
<figure float>
 <caption>Free body diagram </caption>
</figure>
<caption>Free body diagram </caption>
</figure>
Total mass of the buoy (see table weight): Wb= 291 g + 226.4 g =517.4 g = 0.517 kg
Weight of the buoy: P = Wb • g = 0.517 kg • 9.81 m/s2 = 5.07 N
Buoyant Force: Fe = V • g • ρ = 0.00129 m3 • 9.81 m/s2 • 1000 kg/m3 = 12.7 N
It holds that: Fe > P (for free body diagram see figure float) hence the buoy is able to float
Next, we will show you the center of gravity and the buoyancy center of our device.
<figure cmwc>
 <caption>Center of gravity without components</caption>
</figure>
<caption>Center of gravity without components</caption>
</figure>
<figure cb>
 <caption>Center of buoyancy (& water displacement)</caption>
</figure>
<caption>Center of buoyancy (& water displacement)</caption>
</figure>
As we can see in the figures cmwc and cb, the center of gravity is above the center of buoyancy and we need it to be the other way around, so the buoyancy center needs to be above the center of gravity, as it is not the case in our mathematical calculations we have to make sure to put enough components at the bottom of the buoy to bring the center of gravity as low as possible.
- Software Development
The software development is separated into the Arduino code and the mobile application, which consists of the functional application and the aestethical application.
- Arduino Code
To have a better overview on the code the team created a flowchart, which is presented by figure flowc.
<figure flowc>
 <caption>Flowchart of the code</caption>
</figure>
<caption>Flowchart of the code</caption>
</figure>
- Application
The smartphone application is an important feature to offer a pleasant user experience and to drive competitive differentiation, as discussed in the state of the art. Considering the scope of the project and the abilities of the team members the prototype will be divided into an functional application and a aestethical one, which will be explained more precisely in the following.
- Functional application
The on-board sensor data is communicated and stored in a cloud-based IoT platform. Figure EasyIoTModules shows the sensor data user interface implemented with the Easy Internet of Things platform (EasyIoT)[97].
<figure EasyIoTModules>
 <caption>Easy IoT Module </caption>
</figure>
<caption>Easy IoT Module </caption>
</figure>
- Aestethical application
The first step of developing the application was to define the main functionalities, which are
- present the measured data (water temperature, air temperature and turbidity)
- offer a support option
- inform about maintenance (animals or plants)
The figure usecase shows the more detailed use case diagram.
<figure usecase>
 <caption>Use-case diagram </caption>
</figure>
<caption>Use-case diagram </caption>
</figure>
Design: The design of the app is inspired by the appearance of the product, which is modern, clean and simple.
Screens: “Home”: It is separated into “Data” (figure aap.1) and “Info” (figure aap.2). “Data” includes the actual water and air temperature and the turbidity status. Each state has a color coded item, which changes its’ color between red, yellow and green depending on the preferences of the user (see figure aap.8). From each data, there are graphs from either the last week or the last year available (figure aap.3). “Info” includes Informations about animals or plants, which can live in a natural pool. There are five different fishes and 21 different plants, which are again separated into their prefered water depth (see figure aap.4 und aap.5).
- “My stations”: Here are the options “install new station” and “Remove station” in case the customer uses different buoys.
- “Account”: Name and Password for the users’ account.
- “Contact support”(figure aap.7): Either the option of chatting or arranging a personal inspection with an employee.
- “FAQ”: Frequently asked questions
- “Settings” (figure aap.8): Options for the user to set his preferences in temperature, language and measurement unit and interval.
- “About”: Includes the necessary information about the project.
Structure: The main screen of the app is the home screen. Its informations are separated via segmented control and horizontally scrollable containers. From the home screen the user can access the menu, where the other slides are stored. On every screen the user has the possibility to go back to the previous visited page or the menu.
<figure aap>
 1. Home data 1. Home data |  2. Plants 2. Plants |  3. Graphics 3. Graphics |  4. Plantzones 4. Plantzones |
 5. Plants 5. Plants |  6. Menu 6. Menu |  7. Contact support 7. Contact support |  8. Settings 8. Settings |
<caption>Aestethical application preview</caption> </figure>
- Logo and Branding
We are aiming to create an honest, clear and trustworthy brand. The logo and brand name play a vital role in this. We have chosen the name our brand “Aquality” for the following reasons. First of all it is a simple name that represents the purpose of our product well. Created with the combination of the universally known words “aqua” (water) and “quality”, it will be easy for future customers to associate the brand with our core business.
For the logo (see figure logo) we opted to create an abstract shape, which would leave a lot to the imagination. The most essential element in the logo is the presence of water, this has also been deformed to an abstract form. The colour of the logo plays a major part in the right perception of its meaning. We have chosen a light blue (R80 G120 B185), this colour will also be found in other official communication channels and form a harmonious entity.
<figure logo>
<caption> Logo </caption>
</figure>
- Assembly structure
As we chose to 3D print our prototype, we had to take the limitations of this manufacturing technique into account. Therefore several changes to the 3D model had to be made. Due to incorrect measurements of the turbidity sensor, the buoy had to be enlarged to allow all components to fit properly. By enlarging the buoy we encountered one of the main restrictions of a 3D printer: its size limitation. The buoy was to be printed in two separate shells, but these were now to big to fit in the printer. By consequence each shell was cut in two, this means the buoy is printed in 4 different parts. After printing each shell was reconstituted by gluing the two halves together. The following exploded view of the model illustrates the 4 parts that together build up the buoy. Besides enlarging the buoy, several smaller, but significant changes were made s.a. enlarging and rounding the edges of the seal-groove around the watertight compartments. Secondly the mounting bosses in which the screws will be fastened were reinforced by enlarging the fins surrounding them. Besides that a depression was created to place the cork strip. And finally the channel connecting the two watertight compartments was enlarged. Along the way even smaller changes were made, but those are not worth mentioning here.
<figure br>
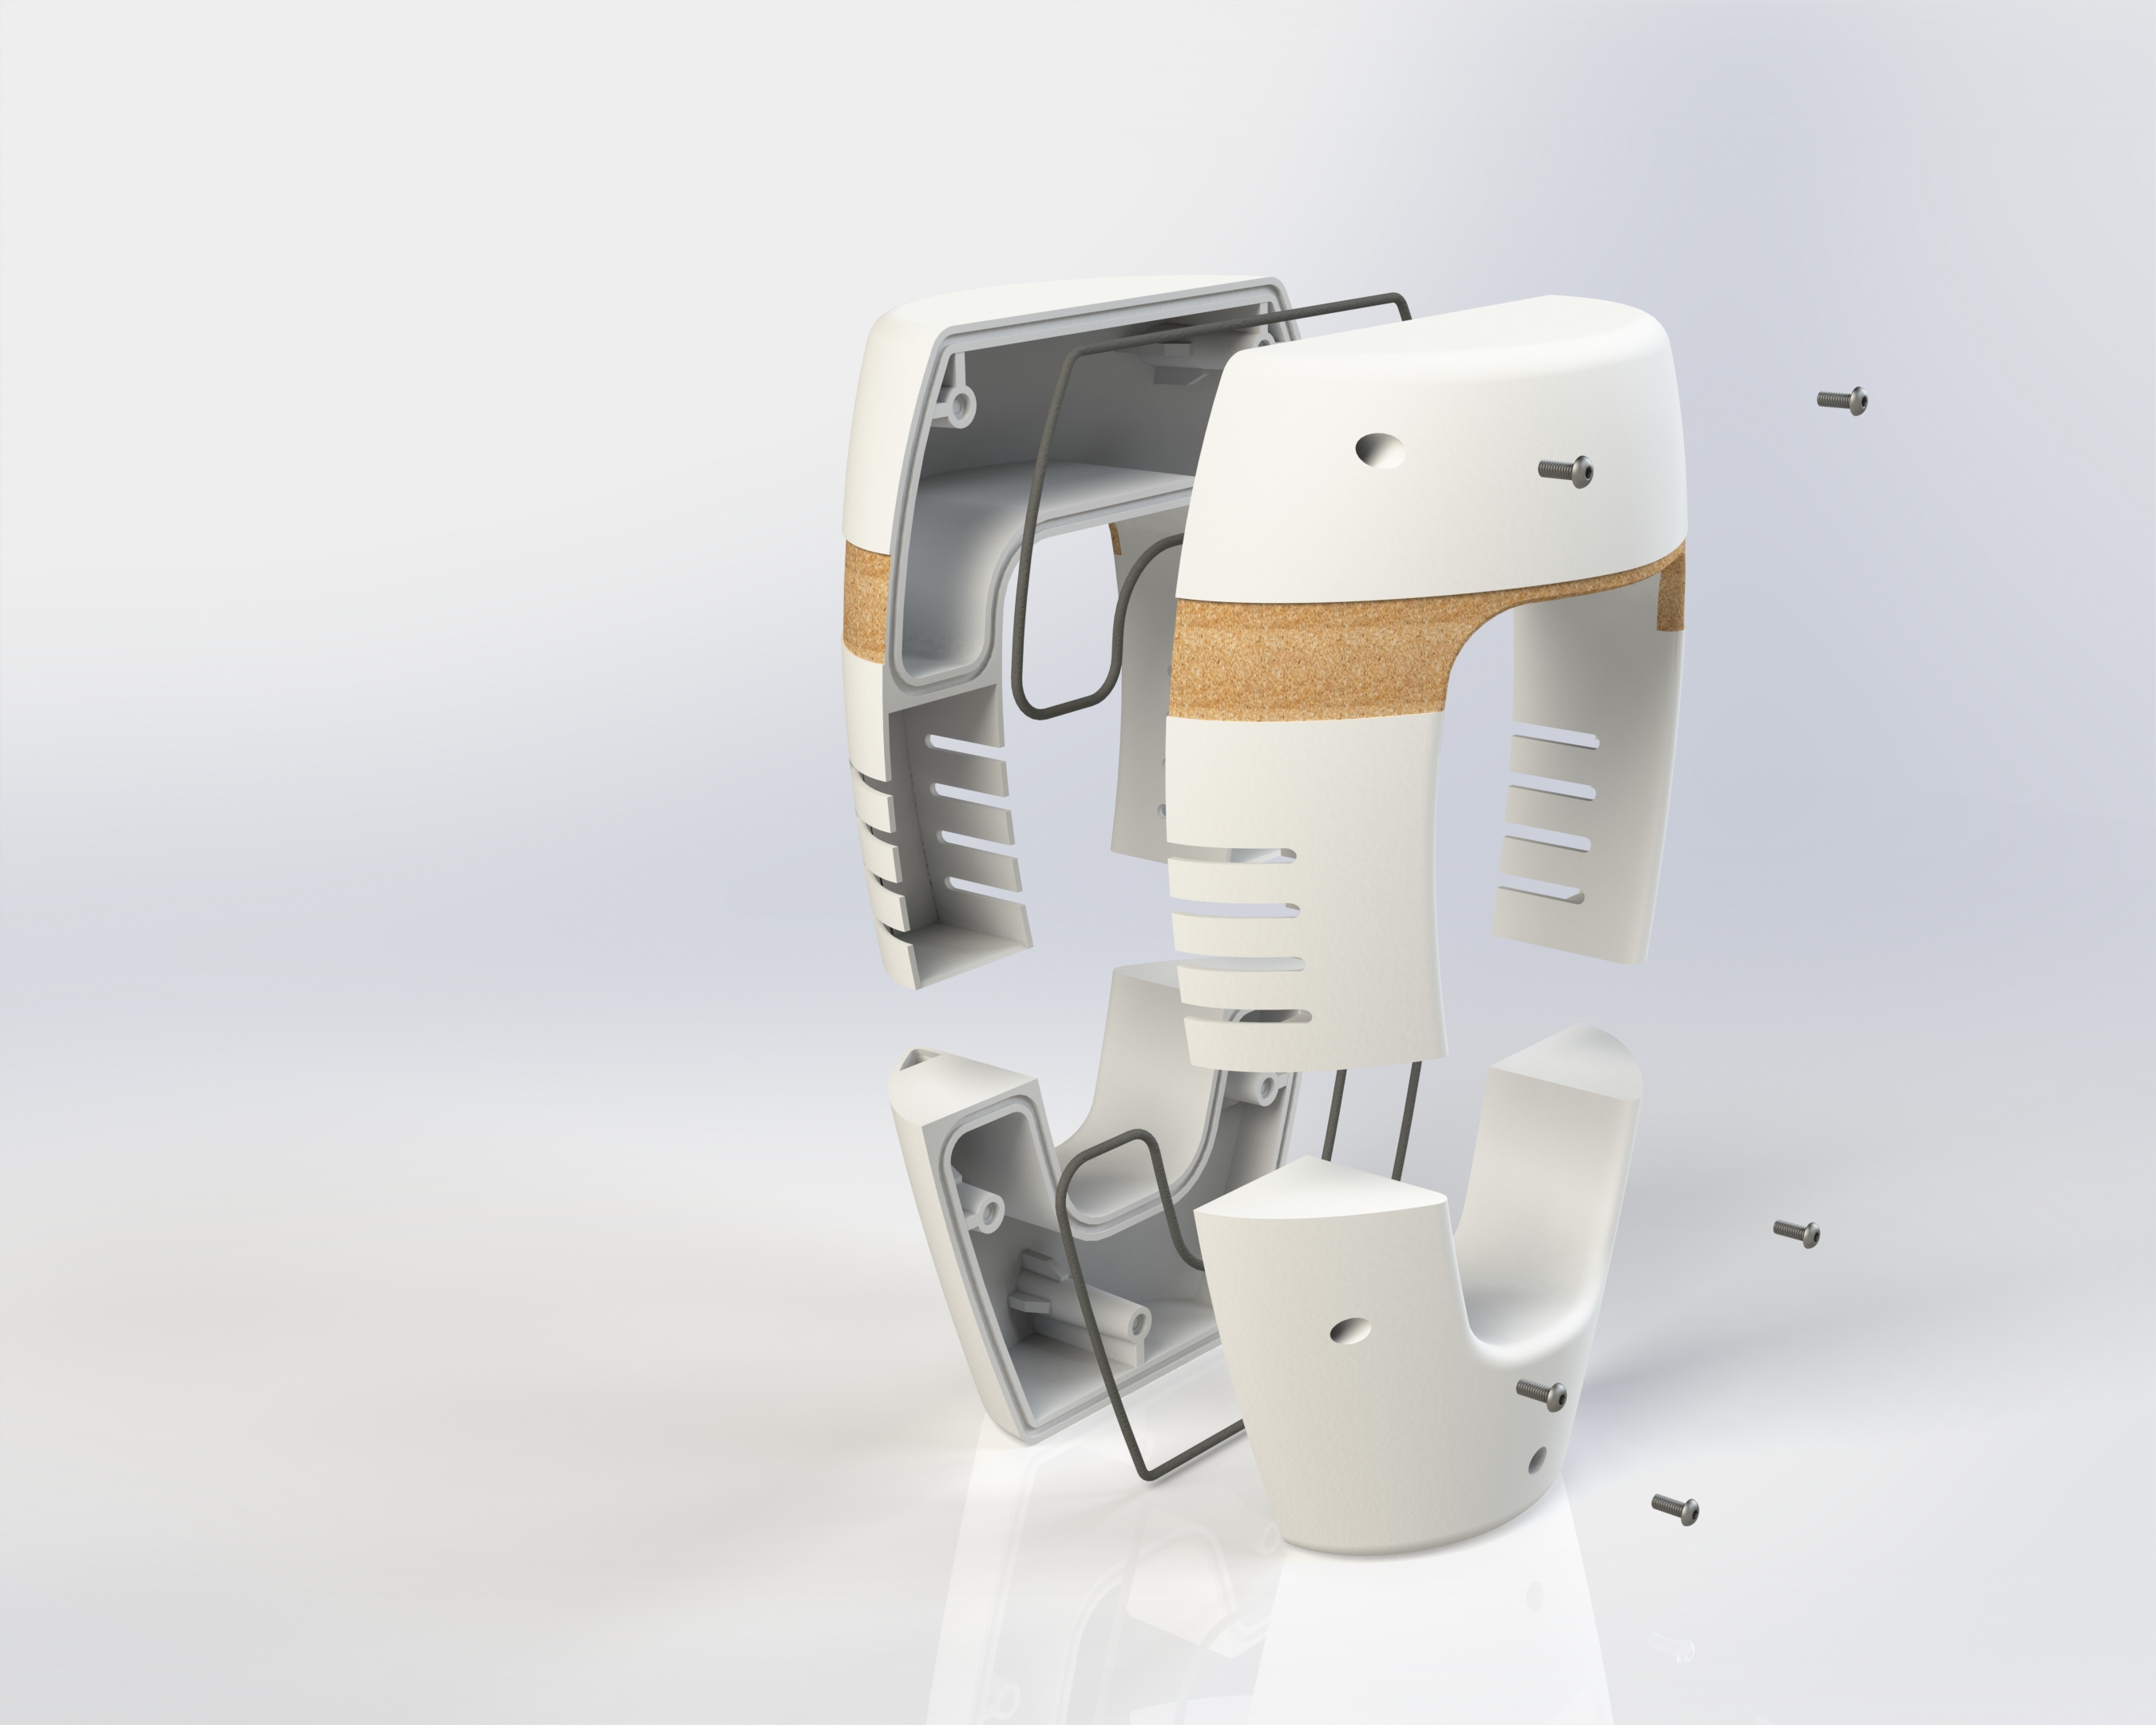 <caption> Exploded view final 3D model </caption>
</figure>
<caption> Exploded view final 3D model </caption>
</figure>
Before assembling the buoy we sanded the 3D prints to smoothen the surface and give it a better look. To assemble the buoy we started to glue the upper and lower part of each shell together. After that we glued the metallic, threaded inserts in the mounting bosses. Once this was done, the two seals were placed around the watertight compartments, in the for this foreseen grooves. Finally, the two shells were secured together using the 5 M 3.5 screws. To prevent any leakages trough the screw holes, o-rings were inserted between the screw heads and the mounting bosses.
Since the measurements of the buoy had changed, two new technical drawings were created. This can be found in the illustrations below.
<figure br>
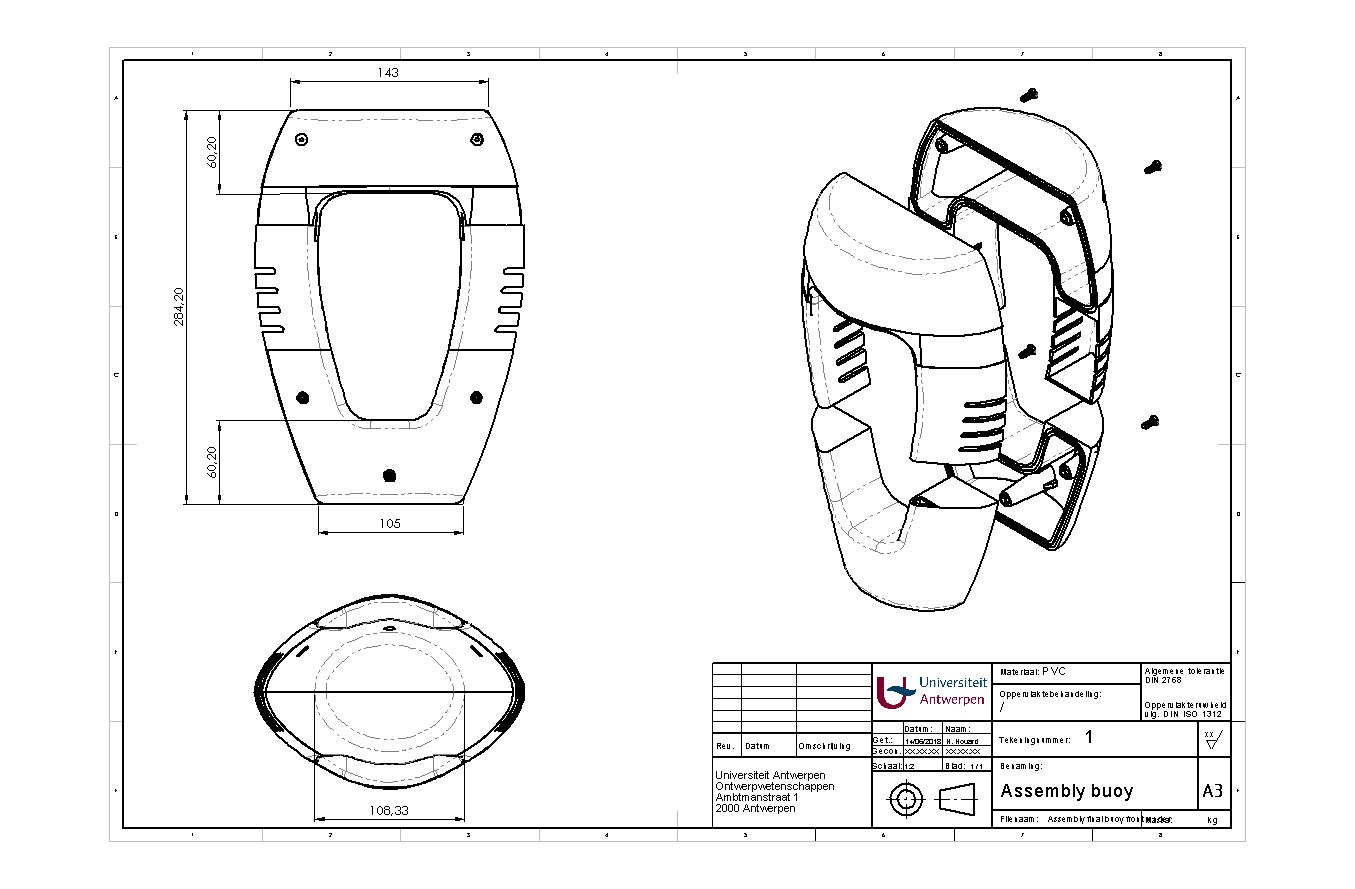 <caption> Technical drawing assembly </caption>
</figure>
<caption> Technical drawing assembly </caption>
</figure>
<figure br>
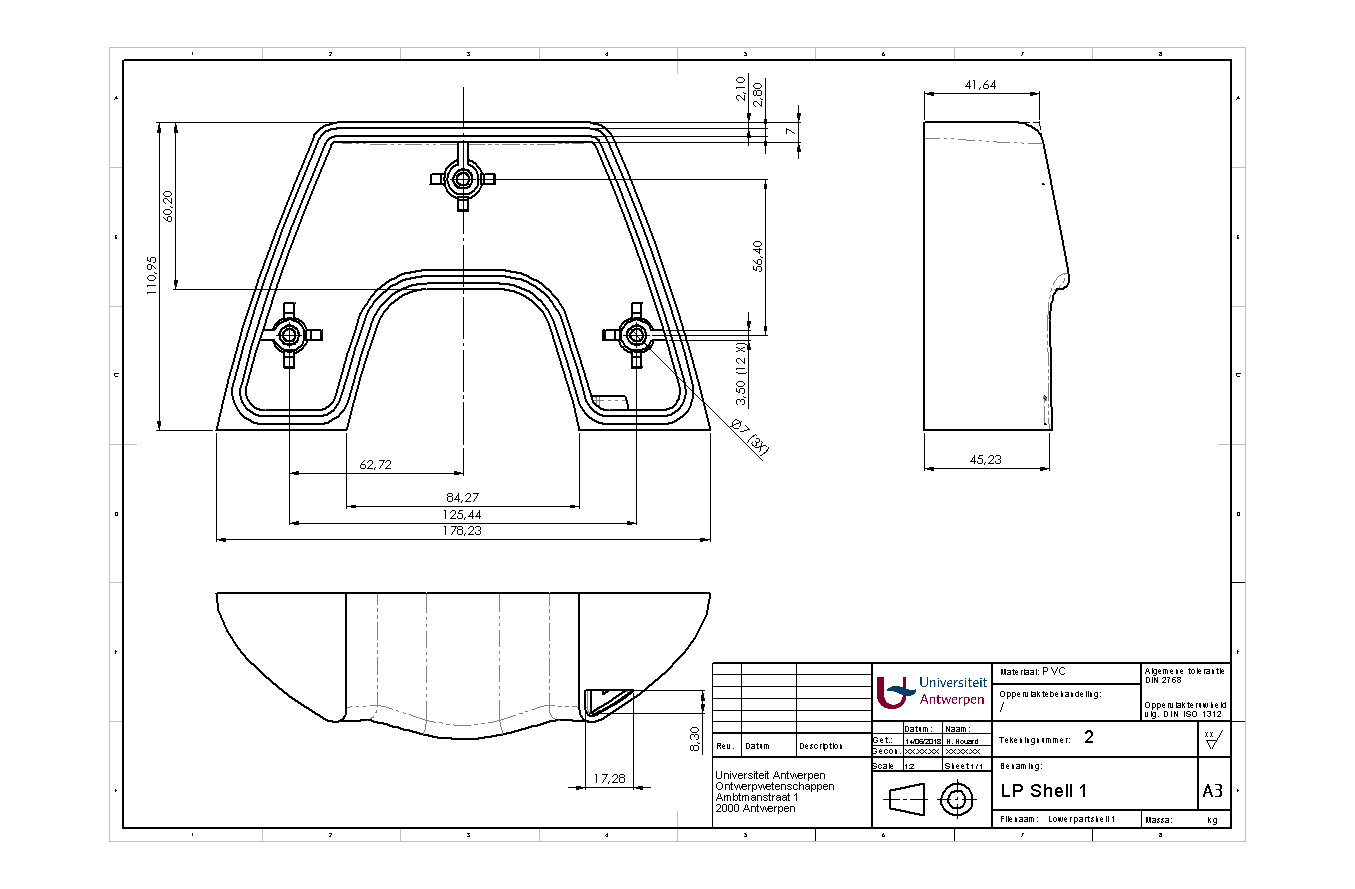 <caption> Technical drawing lower part shell 1 </caption>
</figure>
<caption> Technical drawing lower part shell 1 </caption>
</figure>
<figure br>
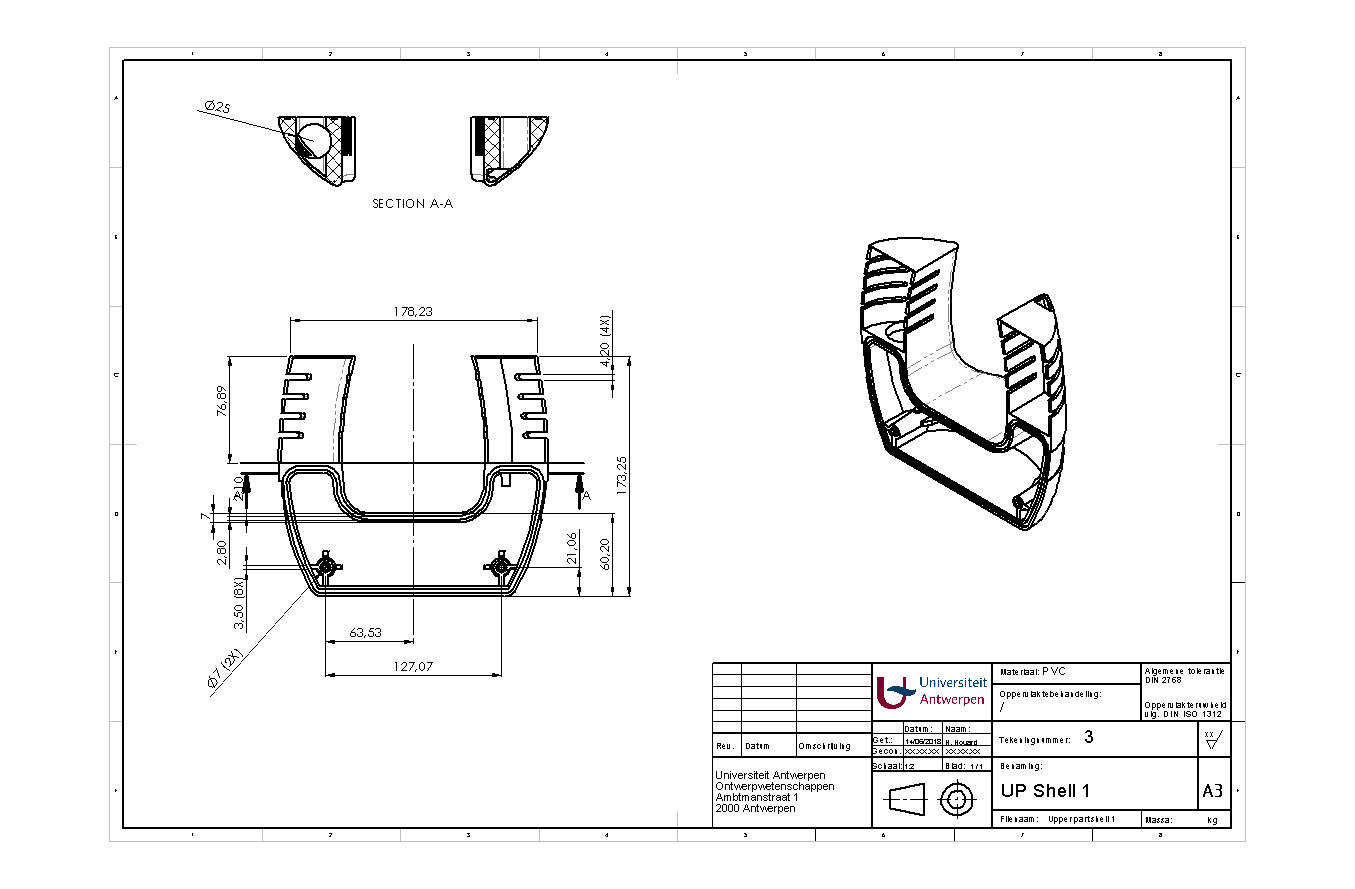 <caption> Technical drawing upper part shell 1 </caption>
</figure>
<caption> Technical drawing upper part shell 1 </caption>
</figure>
Finally renders were created to give an idea of the looks of the buoy in its surroundings.
<figure br>
 <caption> Render buoy surrounding 1 </caption>
</figure>
<caption> Render buoy surrounding 1 </caption>
</figure>
<figure br>
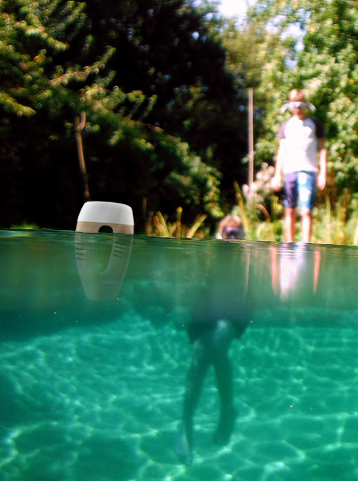 <caption> Render buoy surrounding 2 </caption>
</figure>
<caption> Render buoy surrounding 2 </caption>
</figure>
Building Process
To illustrate the process the team made some pictures while building the prototype. Figure bs1 and figure bs2 show the 3D printing, figure fp shows the final prototype and, because the electronics are hidden in the prototype, figure el shows the electronics.
<figure bs1>
 <caption> Printing part 1 </caption>
</figure>
<caption> Printing part 1 </caption>
</figure>
<figure bs2>
 <caption> Printing part 2 </caption>
</figure>
<caption> Printing part 2 </caption>
</figure>
<figure fp>
 <caption> Final prototype </caption>
</figure>
<caption> Final prototype </caption>
</figure>
<figure el>
 <caption> Electronics </caption>
</figure>
<caption> Electronics </caption>
</figure>
- Tests and Results
In order to examine the operation of the final application several software and hardware tests must be performed. The methodology behind the testing will be based on trial-and-error, which means that the code will be tested, debugged and tuned until the desired results are achieved.
- Software tests
The tests were performed, by submerging one temperature sensor to a water cup and leaving another one in the air. The turbidity is tested, by having two separate cups, one with hazy water and another one with clear water. The following figures describe the sensors test readings. Before 16:00, both temperature sensors are in the air. After 16:30, one sensor is hold in palm to test the reading differences. After 17.00 the sensor is put under water. From there on, the water temperature can be seen rising till it almost reaches room temperature. We have tested the turbidity by changing the sensor between the clear and hazy water cups. In the figure tb, we can see that turbidity has two values: clear and hazy. The sensors placement was changed at 16:00, 17:00, 18:30 and 19:30. The switches can be seen by the changing from “0” , which means clear, to “1”, which stands for “hazy”, in the graph. Test was ended at 20h30.
<figure br>
 <caption>Temperature tests graph </caption>
</figure>
<caption>Temperature tests graph </caption>
</figure>
<figure tb>
 <caption>Turbidity tests graph </caption>
</figure>
<caption>Turbidity tests graph </caption>
</figure>
<figure br>
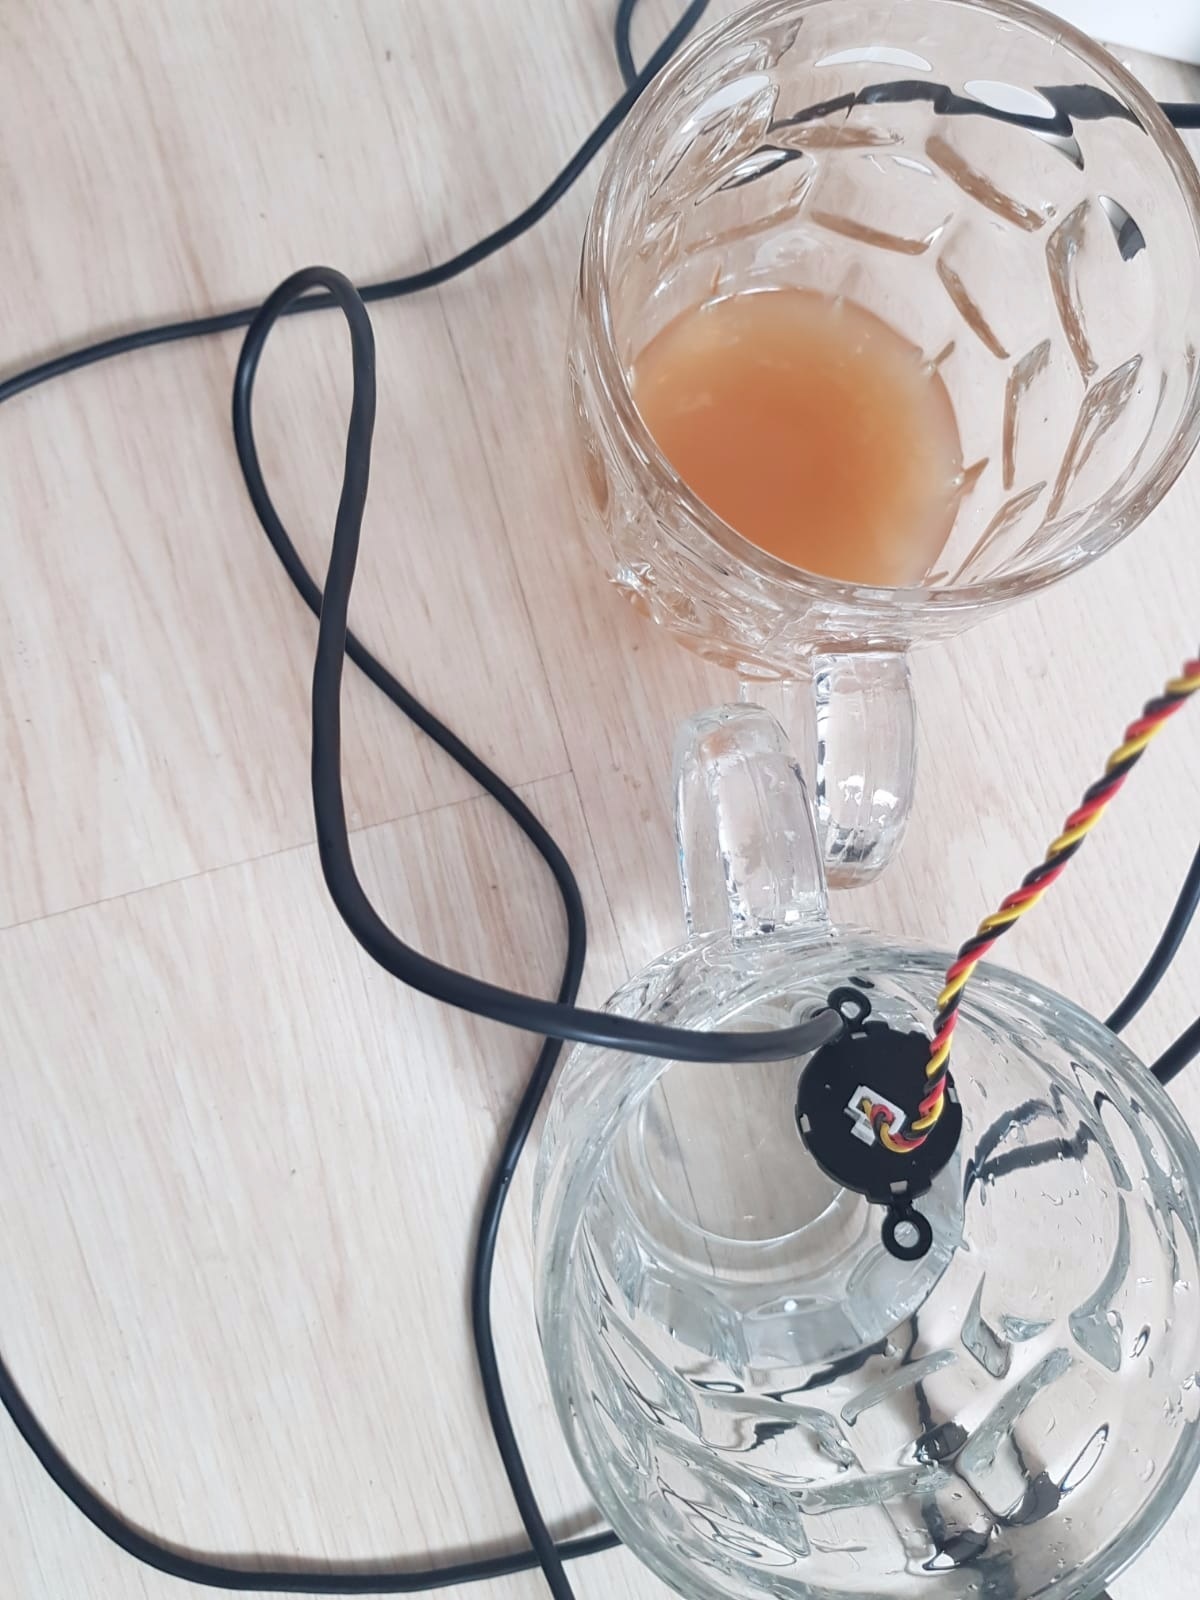 <caption>Sensor tests water cups</caption>
</figure>
<caption>Sensor tests water cups</caption>
</figure>
<figure br>
 <caption> EasyIoT mobile application displaying the data </caption>
</figure>
<caption> EasyIoT mobile application displaying the data </caption>
</figure>
- Hardware tests
The following hardware tests need to be done:
- Watertightness
- Floatability
- Consistency and credibility of the sensor readings
- Wi-Fi reach
- Self-sufficiency of the prototype.
Watertightness will be tested by submerging the prototype underwater for six hours. Afterwards, the interior of prototype will be examined for leakages.
Floatability will be tested by putting the buoy in the water. To achieve the desired waterline on product the ballast must be adjusted.
Sensors consistency and credibility will be tested by submerging the sensors and logging the readings. These readings are compared to calibrated scientific measurement devices and the sensor readings calibrated by software.
Wi-Fi reach will be tested, by measuring the approximate distance of prototype and Wi-Fi router, from the spot, where last signal from prototype is received.
Self-sufficiency of the prototype will be tested, by measuring the time the battery takes to charge and achieve sufficient amount of energy to power the prototype.
- Conclusion
The project development was from the first drafts and modules until the final tests clear structured and well going.
This chapter had addressed the logo and the software, besides some unexpected changes in the software part, satisfactory. The electronics and the architecture needed to be changed several times until every detail fits to the requirements and in the end both were suiting perfectly to the initial vision.
The electronic components and the material had been selected carefully and the tests show that the selection was successful. The team cannot trace the issues with the watertightness to the material decision but to the quality of the printing. The next section concludes the whole project.
- Conclusions
- Discussion
The main objective of the project was to motivate and unite the team around the development of Aquality's proof of concept prototype, while improving the active learning and soft skills of each member. This paper reports this journey.
The product under development is user-friendly, features internet connection and is self-sustainable in terms of power. The user-friendly application and the information it provides is unique as far as the team knows. Because of trends in pool management and worlds constant thrive for a greener future, the potential market is expanding.
Regarding the collaborative learning and teamwork, maintaining the motivation and unity of the team was not always an easy task. The differences in culture, study fields and personalities can lead to frictions within the team. In the case of the Aquality's team, none of the latter issues surfaced because the Team members were determined, but flexible. The acquired project management skills helped to allocate tasks, meet deadlines and achieve the goals of the project.
Quoting Sten Pajula, who was responsible for the electronics and coding of prototype, “The overall experience of the project has been positive. The weekly meetings with the supervisors and teammembers made the semester pass seamlessly. The team had the project deadlines always under control and constant progress was a result of well structured work, which would have been much harder without supportive supervisors and lectures. In this semester, I have learned the basics of product development, marketing and improved the knowledge in my study field”.
- Future Development
Further development is necessary to transform the prototype into a product ready for release into the designated markets. The Aquality prototype is constrained by the time, budget, insufficient knowledge in some technical areas and lack of experience in product development. The following aspects should be considered for future development:
- Development of a professional mobile application;
- Upgrade of the solar panel to fully meet the buoy's energy requirements;
- Reduction of the dimensions of the buoy, including the development of smaller dedicated sensors;
- Expansion of the variety by adding the pH- and oxygen sensors;
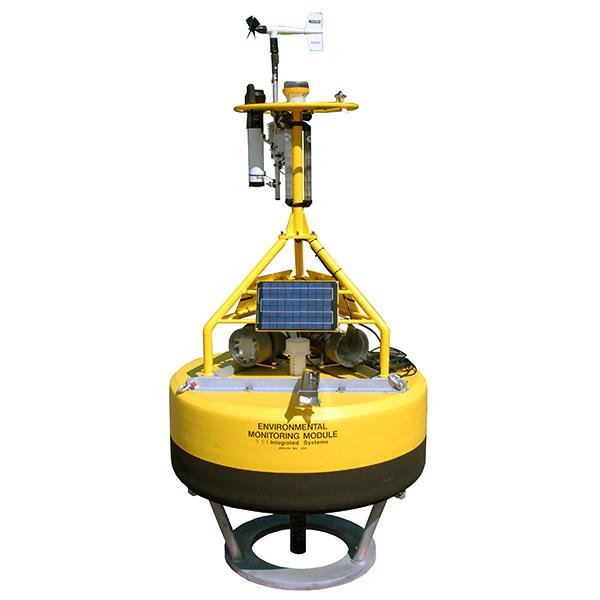